OPEN-SOURCE SCRIPT
Percentage Change per 5 Candles
🔎 What this indicator does
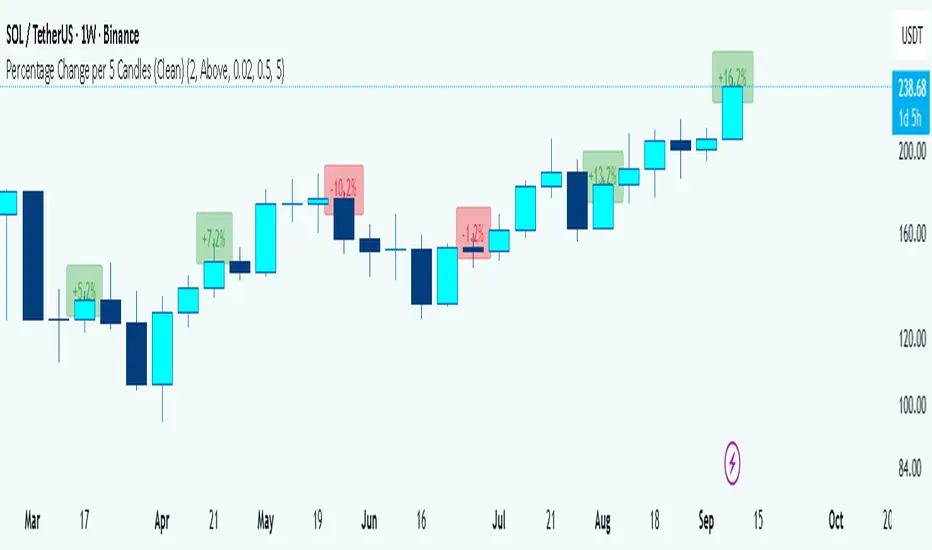
This indicator calculates and displays the percentage change of each candlestick directly on the chart.
• If a candle closed higher than it opened (bullish candle), it shows a positive % change (green).
• If a candle closed lower than it opened (bearish candle), it shows a negative % change (red).
• Small moves below your chosen threshold (e.g., 0.1%) are ignored to avoid clutter.
• The labels are placed above, below, or in the center of the candle (you choose).
So essentially, every candle “tells you in numbers” exactly how much it changed relative to its opening price.
________________________________________
⚙️ How it operates (the logic inside)
1. Calculate the change
o Formula:
\text{% Change} = \frac{(\text{Close} - \text{Open})}{\text{Open}} \times 100
o Example: If a candle opens at 100 and closes at 105, that’s a +5% change.
2. Round it nicely
o You can control decimals (e.g., show 2 decimals → +5.23%).
3. Filter out noise
o If a candle barely moved (say 0.02%), the label won’t appear unless you reduce the threshold.
4. Style the labels
o Bullish = green text, slightly transparent green background.
o Bearish = red text, slightly transparent red background.
o Neutral (0%) = gray.
5. Place the labels
o Options: above the candle, below the candle, or centered.
o Small vertical offset is applied so labels don’t overlap the candle itself.
________________________________________
📊 How this helps traders
This indicator turns visual candles into quantifiable numbers at a glance. Instead of guessing whether a move was “big” or “small,” you see it clearly.
Key Benefits:
1. Quick volatility analysis
o You can instantly see if candles are making big % swings or just small moves.
o This is especially useful on higher timeframes (daily/weekly) where moves can be large.
2. Pattern confirmation
o For example, you might spot a strong bullish engulfing candle — the % change label helps confirm whether it was truly significant (e.g., +4.5%) or just modest (+0.7%).
3. Noise filtering
o By setting a minimum % threshold, you only see labels when moves are meaningful (say > 0.5%). This keeps focus on important candles.
4. Backtesting & comparison
o You can compare moves across time:
“How strong was this breakout candle compared to the last one?”
“Are today’s bearish candles weaker or stronger than yesterday’s bullish candles?”
5. Better decision-making
o If you’re trading breakouts, reversals, or trend-following, knowing the % size of each candle helps confirm if the move has enough momentum.
________________________________________
✅ In short:
This indicator quantifies price action. Instead of just seeing “green” or “red” candles, you now know exactly how much the price changed in percentage terms, directly on the chart, in real time. It helps you distinguish between strong and weak moves and makes your analysis more precise.
________________________________________
Open-source script
In true TradingView spirit, the creator of this script has made it open-source, so that traders can review and verify its functionality. Kudos to the author! While you can use it for free, remember that republishing the code is subject to our House Rules.
Trade forex, indices, stocks and metals with up to US$100.000 in company's funding.
Complete a challenge to access funding or go for instant deposit.
Trading involves substantial risk. Not financial advice
Complete a challenge to access funding or go for instant deposit.
Trading involves substantial risk. Not financial advice
Disclaimer
The information and publications are not meant to be, and do not constitute, financial, investment, trading, or other types of advice or recommendations supplied or endorsed by TradingView. Read more in the Terms of Use.