PROTECTED SOURCE SCRIPT
1HR Pivots & Pre-Market Levels
1HR Pivots & Pre-Market Levels Indicator
Overview
This indicator is designed for intraday traders who want to identify key price levels that often act as support and resistance throughout the trading day. It combines multiple timeframe analysis into a single, clean overlay on your chart.
Key Features
1-Hour Pivot Levels
The indicator automatically detects significant swing highs and lows from the 1-hour timeframe and displays them as horizontal levels on your chart, regardless of what timeframe you're viewing. These pivots are calculated using closing prices (line chart style) rather than wicks, which provides cleaner, more reliable levels. You can display up to 20 pivot levels and customize how sensitive the detection is.
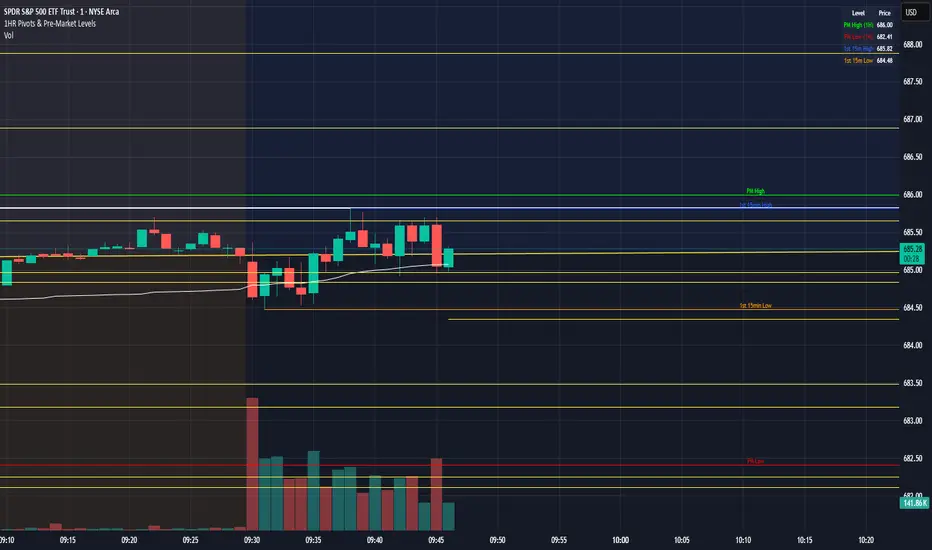
Pre-Market High & Low
Before the regular session opens, price action in the pre-market often establishes important boundaries for the day. This indicator tracks and displays the pre-market high (green) and low (red) from 4:00 AM to 9:30 AM Eastern Time. These levels are derived from 1 min prices including wicks.
First 15-Minute Range
The opening 15 minutes of the regular session (9:30-9:45 AM ET) frequently sets the tone for the rest of the day. The indicator marks the high (blue) and low (orange) of this critical period, including wicks, giving you clear reference points for potential breakout or reversal trades.
Session VWAP
Volume Weighted Average Price is included as a white line that resets daily. VWAP represents the average price weighted by volume and is widely used by institutional traders. Price trading above VWAP suggests bullish sentiment, while price below suggests bearish sentiment.
Why It's Useful
Multi-timeframe context on any chart - View 1-hour levels while trading on a 1-minute or 5-minute chart
Key session-based levels - Pre-market range and opening range are proven reference points for day traders
Clean visualization - All levels draw from their origin point so you can see exactly where each level was established
Fully customizable - Adjust colors, line thickness, and number of levels to match your preferences
Information table - Quick reference panel showing exact prices for all key levels
Best Used For
Identifying potential support and resistance zones
Planning entries and exits around key levels
Gauging whether price is extended or at value (using VWAP)
Understanding the day's structure at a glance
Overview
This indicator is designed for intraday traders who want to identify key price levels that often act as support and resistance throughout the trading day. It combines multiple timeframe analysis into a single, clean overlay on your chart.
Key Features
1-Hour Pivot Levels
The indicator automatically detects significant swing highs and lows from the 1-hour timeframe and displays them as horizontal levels on your chart, regardless of what timeframe you're viewing. These pivots are calculated using closing prices (line chart style) rather than wicks, which provides cleaner, more reliable levels. You can display up to 20 pivot levels and customize how sensitive the detection is.
Pre-Market High & Low
Before the regular session opens, price action in the pre-market often establishes important boundaries for the day. This indicator tracks and displays the pre-market high (green) and low (red) from 4:00 AM to 9:30 AM Eastern Time. These levels are derived from 1 min prices including wicks.
First 15-Minute Range
The opening 15 minutes of the regular session (9:30-9:45 AM ET) frequently sets the tone for the rest of the day. The indicator marks the high (blue) and low (orange) of this critical period, including wicks, giving you clear reference points for potential breakout or reversal trades.
Session VWAP
Volume Weighted Average Price is included as a white line that resets daily. VWAP represents the average price weighted by volume and is widely used by institutional traders. Price trading above VWAP suggests bullish sentiment, while price below suggests bearish sentiment.
Why It's Useful
Multi-timeframe context on any chart - View 1-hour levels while trading on a 1-minute or 5-minute chart
Key session-based levels - Pre-market range and opening range are proven reference points for day traders
Clean visualization - All levels draw from their origin point so you can see exactly where each level was established
Fully customizable - Adjust colors, line thickness, and number of levels to match your preferences
Information table - Quick reference panel showing exact prices for all key levels
Best Used For
Identifying potential support and resistance zones
Planning entries and exits around key levels
Gauging whether price is extended or at value (using VWAP)
Understanding the day's structure at a glance
Protected script
This script is published as closed-source. However, you can use it freely and without any limitations – learn more here.
Disclaimer
The information and publications are not meant to be, and do not constitute, financial, investment, trading, or other types of advice or recommendations supplied or endorsed by TradingView. Read more in the Terms of Use.