PROTECTED SOURCE SCRIPT
Updated Impulse Top/Bottom Zones
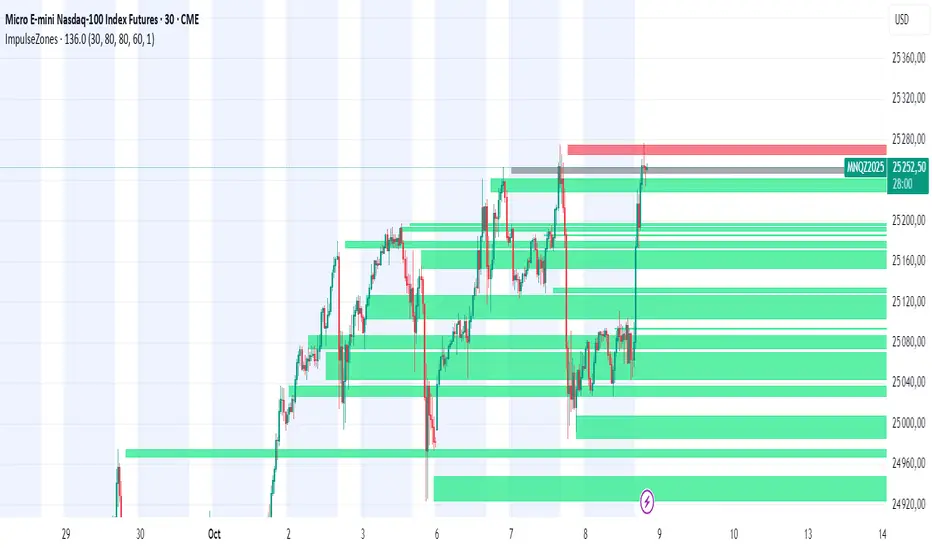
Automatically detects impulsive supply and demand zones and displays dynamic reaction areas on the chart.
Release Notes
The Impulse Top/Bottom Zones indicator automatically identifies key supply and demand areas formed by strong impulsive moves.It highlights breakout and reversal zones to help traders visualize potential reaction points in trending or ranging markets.
⚠️ Note: Zone alignment may slightly vary when switching timeframes or resizing the chart due to platform limitations.
Release Notes
The Impulse Top/Bottom Zones MTF indicator automatically detects major supply and demand areas generated by strong impulsive moves.It identifies pivot-based breakout or reversal points and draws dynamic zones that remain aligned with price across all timeframes — from intraday to higher timeframes like 4H and Daily.
Each zone represents a potential area of institutional activity where liquidity, imbalance, or order flow reactions are likely to occur.
The indicator adapts seamlessly across timeframes, helping traders visualize key decision zones and structure the market more clearly.
⚡ Designed for price action and smart money concepts traders who rely on multi-timeframe confluence.
⚠️ Note: Slight graphical variations may occur when switching chart types or scaling due to TradingView rendering limitations.
Release Notes
MajRelease Notes
🔄 Update v1.1 — Enhanced Visual CustomizationThis update focuses entirely on style flexibility while keeping the original detection algorithm unchanged.
🧭 What’s new:
Added color intensity control — adjust tone brightness and contrast.
Added fill opacity setting — control the transparency inside zones.
Added border customization — toggle border color from the zone, adjust opacity and width.
Preserved the same time-anchored logic and multi-timeframe impulse detection.
Small UI polish: grouped all visual options under “Style”.
⚙️ Core logic:
No change in the mathematical or detection logic — only visual improvements.
Release Notes
MajProtected script
This script is published as closed-source. However, you can use it freely and without any limitations – learn more here.
Disclaimer
The information and publications are not meant to be, and do not constitute, financial, investment, trading, or other types of advice or recommendations supplied or endorsed by TradingView. Read more in the Terms of Use.
Protected script
This script is published as closed-source. However, you can use it freely and without any limitations – learn more here.
Disclaimer
The information and publications are not meant to be, and do not constitute, financial, investment, trading, or other types of advice or recommendations supplied or endorsed by TradingView. Read more in the Terms of Use.