OPEN-SOURCE SCRIPT
Linear Regression CVD
Here is the complete user manual and introduction for the Linear Regression CVD indicator in English. You can save this as your documentation for your trading system.
📊 Linear Regression CVD – Trader’s Manual
1. Introduction
Core Concept:
Standard Cumulative Volume Delta (CVD) indicators are often noisy and jagged, making it difficult to decipher the true direction of capital flow. This indicator applies a Linear Regression algorithm to smooth out the CVD data and adds a Standard Deviation Channel. It is designed to answer two critical questions:
What is the "True Trend" of the money flow? (Filtering out noise)
Is the market sentiment currently overheated? (Using the channel to spot extremes)
Best Markets:
Crypto Perpetual Futures (e.g., BTCUSDT.P) — Highly Recommended.
Stocks & Forex (Must have volume data).
Timeframes:
Scalping: 1m, 5m, 15m (To catch rapid capital inflows/outflows).
Swing Trading: 1H, 4H (To identify the dominant direction of "Smart Money").
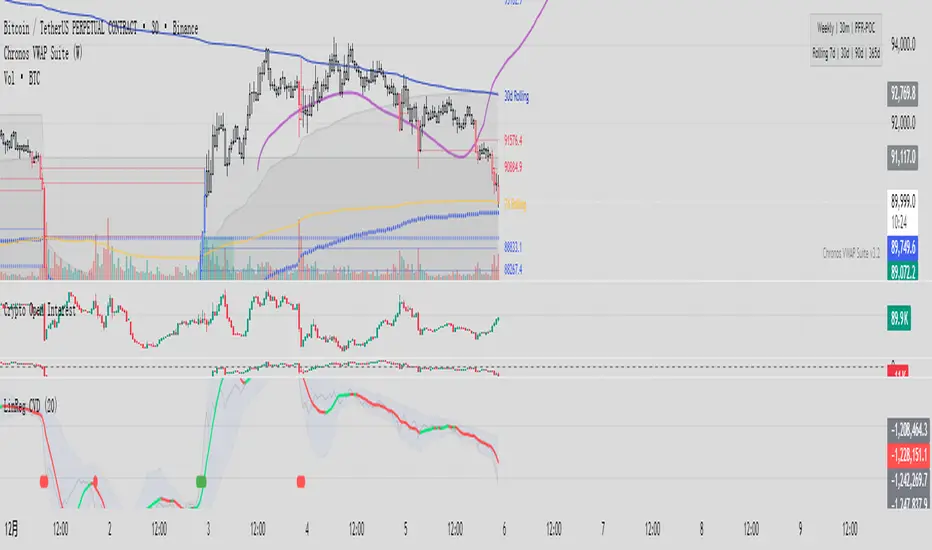
2. Visual Guide
When you load the indicator, you will see the following elements:
A. The Main Line (Linear Regression)
Appearance: A smooth, thick line.
Meaning: The average trend of capital flow.
Color Logic:
🟢 Green: Money flow is trending UP (Buyers are dominant).
🔴 Red: Money flow is trending DOWN (Sellers are dominant).
B. The Raw Line (Gray Hairline)
Appearance: A thin, jagged gray line fluctuating around the main line.
Meaning: The Raw, Real-time CVD. It calculates the volume delta (Close vs. Open) for every single candle without smoothing.
C. The Channel (Blue Background)
Appearance: A blue shaded area around the main line.
Meaning: The "Normal Volatility Range."
Calculated based on 2 Standard Deviations (2σ) from the Linear Regression.
If the Gray Line stays inside this channel, the market is stable/balanced.
D. The Signal Dots
🟢 Green Dot (Upside Extension): The Raw CVD has broken above the upper channel.
Meaning: Extreme Greed / Aggressive Buying / FOMO.
🔴 Red Dot (Downside Extension): The Raw CVD has broken below the lower channel.
Meaning: Extreme Fear / Panic Selling / Capitulation.
3. Trading Strategies
Strategy 1: Trend Confirmation
The basic "Follow the Money" approach.
Bullish Signal (Long):
Price is making Higher Highs.
CVD Main Line turns Green and slopes upward.
Action: Confirms that the price rise is backed by real volume. Hold or Add to Longs.
Bearish Signal (Short):
Price is making Lower Lows.
CVD Main Line turns Red and slopes downward.
Action: Confirms that sellers are in control. Hold Shorts.
Strategy 2: Divergence (High Win Rate)
Finding disagreements between "Price" and "Money Flow".
Bearish Divergence (Top Signal):
Price makes a Higher High.
CVD Main Line makes a Lower High (or fails to break out).
Meaning: Price is rising, but buying effort is fading (Exhaustion) or Limit Sellers are absorbing the buy orders (Absorption).
Action: Look for Short entries.
Bullish Divergence (Bottom Signal):
Price makes a Lower Low.
CVD Main Line makes a Higher Low.
Meaning: Price is dropping, but selling pressure is drying up, or Smart Money is absorbing sell orders via limit buy orders.
Action: Look for Long entries.
Strategy 3: Mean Reversion (Extreme Extensions)
Using the Red/Green dots to fade extremes.
Long Opportunity (Bounce):
Price crashes rapidly.
Cluster of Red Dots appears at the bottom.
Meaning: Panic selling has peaked (Capitulation). The market is oversold on a volume basis.
Action: Wait for a candle reversal pattern, then Long for a bounce.
Short Opportunity (Pullback):
Price pumps vertically.
Cluster of Green Dots appears at the bottom.
Meaning: Retail traders are chasing the pump (FOMO). Buying power is overextended.
Action: Wait for momentum to stall, then Short.
4. Important Limitations & Notes
Data Source Accuracy:
TradingView Standard Volume is an approximation (Close vs. Open logic).
It is not perfect "Tick Data" (like professional Orderflow software), but it is 90% accurate for trend analysis on 1H/4H charts.
Tip: Always use Perpetual Contract charts (e.g., BTCUSDT.P) for Crypto, not Spot charts, to get the correct volume data.
The "Extension" Trap:
Do not Short just because you see a Green Dot. In a strong parabolic bull run, you will see many Green Dots in a row while price keeps flying.
These dots indicate velocity, not necessarily a reversal. Always look for resistance levels or divergence before fading the move.
Settings:
Default Length: 20.
For faster signals: Try 10 or 14.
For smoother trends: Try 50.
5. Pre-Trade Checklist
Before entering a trade, check the Linear CVD:
Color: Is the CVD Line Green or Red? Does it match my trade direction?
Slope: Is the CVD accelerating or flattening out?
Divergence: Did price break a level, but CVD failed to follow? (Fakeout warning).
Extremes: Are there Red/Green dots appearing? If yes, am I chasing a trade too late?
这是一套完整的线性回归 CVD (Linear Regression CVD) 指标的使用说明书和简介。你可以把它保存下来,作为你的交易系统参考文档。
📊 线性回归 CVD (Linear Regression CVD) —— 交易员手册
1. 指标简介 (Introduction)
核心理念:
普通的 CVD(累积成交量差)往往噪音很大,线条锯齿状严重,导致交易者难以看清真正的资金流向趋势。本指标通过线性回归算法 (Linear Regression) 对 CVD 进行平滑处理,并结合标准差通道 (Standard Deviation Channel),试图解决两个核心问题:
资金流向的真实趋势是什么?(排除噪音)
当前的情绪是否过热?(通过通道判定)
适用市场:
加密货币合约 (BTC, ETH 等永续合约) —— 效果最佳
股票、外汇 (需有成交量数据)
适用周期:
日内短线:1分钟、5分钟、15分钟(捕捉快速的资金进出)。
趋势波段:1小时、4小时(判断主力资金的大方向)。
2. 视觉元素说明 (Visual Guide)
当你加载指标后,你会看到以下几个部分:
A. 彩色主线 (The LinReg Line)
形态:一条平滑的粗线。
含义:资金流向的**“平均趋势”**。
颜色:
🟢 绿色:资金流向趋势向上(买盘主导)。
🔴 红色:资金流向趋势向下(卖盘主导)。
B. 灰色背景细线 (Raw CVD)
形态:一条充满锯齿的灰色细线,在主线周围波动。
含义:原始的、实时的累积成交量。它反应了当下的每一根K线的实际买卖差额。
C. 蓝色背景通道 (The Channel)
形态:包裹在主线周围的深蓝色带状区域。
含义:“正常波动范围”。
基于线性回归的 2倍标准差计算。
如果灰色细线在通道内运行,说明市场情绪稳定,多空力量均衡。
D. 信号点 (The Dots)
🟢 绿点 (底部出现):原始 CVD 向上突破了通道上轨。代表极度贪婪 / 抢筹。
🔴 红点 (底部出现):原始 CVD 向下跌破了通道下轨。代表极度恐慌 / 抛售。
3. 实战交易策略 (Trading Strategies)
策略一:趋势确认 (Trend Following)
这是最基础的顺势用法。
做多信号:
价格处于上升趋势(如在均线之上)。
CVD 主线由红变绿,且持续向上倾斜。
操作:这确认了价格的上涨有真金白银的买盘支持,可以持有或加仓。
做空信号:
价格处于下降趋势。
CVD 主线由绿变红,且持续向下倾斜。
操作:确认卖盘主导,价格下跌是健康的。
策略二:背离交易 (Divergence) —— 胜率最高的用法
寻找“主力资金”与“价格”不一致的地方。
顶背离 (看跌):
价格创出了新高 (Higher High)。
CVD 主线却没有创新高,或者形成更低的高点 (Lower High)。
含义:价格在涨,但买入的资金在减少。这通常是主力在通过限价单悄悄出货,或者是买盘枯竭。
操作:准备做空,或多单止盈。
底背离 (看涨):
价格创出了新低 (Lower Low)。
CVD 主线却形成了更高的低点 (Higher Low)。
含义:价格在跌,但卖出的资金在减少,或者有大资金在底部通过挂单吸筹 (Absorption)。
操作:准备做多,或空单止盈。
策略三:极端情绪反转 (Mean Reversion)
利用红绿点判断短期的超买超卖。
做多机会 (反弹):
价格快速下跌,甚至暴跌。
指标底部出现密集的红点 (Downside Extension)。
含义:恐慌盘被杀出来了 (Capitulation),市场短期内无可再卖。
操作:等待K线出现反转形态(如长下影线)后尝试博反弹。
做空机会 (回调):
价格快速拉升(垂直上涨)。
指标底部出现密集的绿点 (Upside Extension)。
含义:大量的散户在追涨 (FOMO),透支了买盘动能。
操作:等待上涨停滞后尝试做空。
4. 关键注意事项 (Limitations)
数据源区别:
TradingView 的普通 Volume 是基于 K 线的近似计算(Close > Open 算买,Close < Open 算卖)。
这与专业的 Orderflow 软件(如 Exocharts)使用的逐笔 Tick 数据有一定误差,但在 1小时/4小时 级别上,趋势方向基本一致。
建议:如果你是做合约,请务必加载 合约图表(如 BTCUSDT.P),不要用现货图表看 CVD。
红绿点的陷阱:
不要一看到绿点就做空! 在超级大单边行情(比如牛市主升浪)中,绿点会连续出现,价格会一直涨。
红绿点必须配合 关键支撑/阻力位 使用。如果在“半空中”出现绿点,往往意味着趋势加速,而不是反转。
参数调整:
默认 LinReg Length = 20。
如果你觉得反应太慢,可以改为 10 或 14。
如果你觉得假信号太多,可以改为 50,但这会牺牲灵敏度。
5. 快速检查清单 (Checklist)
在开单前,看一眼 CVD:
颜色:CVD 是绿的还是红的?和我想做的方向一致吗?
斜率:CVD 是在加速上升/下降,还是开始变平了?
背离:价格破位了,CVD 跟着破位了吗?如果没跟,就是假突破。
极值:有没有出现红点/绿点?如果出现了,是不是应该等回调再进场?
📊 Linear Regression CVD – Trader’s Manual
1. Introduction
Core Concept:
Standard Cumulative Volume Delta (CVD) indicators are often noisy and jagged, making it difficult to decipher the true direction of capital flow. This indicator applies a Linear Regression algorithm to smooth out the CVD data and adds a Standard Deviation Channel. It is designed to answer two critical questions:
What is the "True Trend" of the money flow? (Filtering out noise)
Is the market sentiment currently overheated? (Using the channel to spot extremes)
Best Markets:
Crypto Perpetual Futures (e.g., BTCUSDT.P) — Highly Recommended.
Stocks & Forex (Must have volume data).
Timeframes:
Scalping: 1m, 5m, 15m (To catch rapid capital inflows/outflows).
Swing Trading: 1H, 4H (To identify the dominant direction of "Smart Money").
2. Visual Guide
When you load the indicator, you will see the following elements:
A. The Main Line (Linear Regression)
Appearance: A smooth, thick line.
Meaning: The average trend of capital flow.
Color Logic:
🟢 Green: Money flow is trending UP (Buyers are dominant).
🔴 Red: Money flow is trending DOWN (Sellers are dominant).
B. The Raw Line (Gray Hairline)
Appearance: A thin, jagged gray line fluctuating around the main line.
Meaning: The Raw, Real-time CVD. It calculates the volume delta (Close vs. Open) for every single candle without smoothing.
C. The Channel (Blue Background)
Appearance: A blue shaded area around the main line.
Meaning: The "Normal Volatility Range."
Calculated based on 2 Standard Deviations (2σ) from the Linear Regression.
If the Gray Line stays inside this channel, the market is stable/balanced.
D. The Signal Dots
🟢 Green Dot (Upside Extension): The Raw CVD has broken above the upper channel.
Meaning: Extreme Greed / Aggressive Buying / FOMO.
🔴 Red Dot (Downside Extension): The Raw CVD has broken below the lower channel.
Meaning: Extreme Fear / Panic Selling / Capitulation.
3. Trading Strategies
Strategy 1: Trend Confirmation
The basic "Follow the Money" approach.
Bullish Signal (Long):
Price is making Higher Highs.
CVD Main Line turns Green and slopes upward.
Action: Confirms that the price rise is backed by real volume. Hold or Add to Longs.
Bearish Signal (Short):
Price is making Lower Lows.
CVD Main Line turns Red and slopes downward.
Action: Confirms that sellers are in control. Hold Shorts.
Strategy 2: Divergence (High Win Rate)
Finding disagreements between "Price" and "Money Flow".
Bearish Divergence (Top Signal):
Price makes a Higher High.
CVD Main Line makes a Lower High (or fails to break out).
Meaning: Price is rising, but buying effort is fading (Exhaustion) or Limit Sellers are absorbing the buy orders (Absorption).
Action: Look for Short entries.
Bullish Divergence (Bottom Signal):
Price makes a Lower Low.
CVD Main Line makes a Higher Low.
Meaning: Price is dropping, but selling pressure is drying up, or Smart Money is absorbing sell orders via limit buy orders.
Action: Look for Long entries.
Strategy 3: Mean Reversion (Extreme Extensions)
Using the Red/Green dots to fade extremes.
Long Opportunity (Bounce):
Price crashes rapidly.
Cluster of Red Dots appears at the bottom.
Meaning: Panic selling has peaked (Capitulation). The market is oversold on a volume basis.
Action: Wait for a candle reversal pattern, then Long for a bounce.
Short Opportunity (Pullback):
Price pumps vertically.
Cluster of Green Dots appears at the bottom.
Meaning: Retail traders are chasing the pump (FOMO). Buying power is overextended.
Action: Wait for momentum to stall, then Short.
4. Important Limitations & Notes
Data Source Accuracy:
TradingView Standard Volume is an approximation (Close vs. Open logic).
It is not perfect "Tick Data" (like professional Orderflow software), but it is 90% accurate for trend analysis on 1H/4H charts.
Tip: Always use Perpetual Contract charts (e.g., BTCUSDT.P) for Crypto, not Spot charts, to get the correct volume data.
The "Extension" Trap:
Do not Short just because you see a Green Dot. In a strong parabolic bull run, you will see many Green Dots in a row while price keeps flying.
These dots indicate velocity, not necessarily a reversal. Always look for resistance levels or divergence before fading the move.
Settings:
Default Length: 20.
For faster signals: Try 10 or 14.
For smoother trends: Try 50.
5. Pre-Trade Checklist
Before entering a trade, check the Linear CVD:
Color: Is the CVD Line Green or Red? Does it match my trade direction?
Slope: Is the CVD accelerating or flattening out?
Divergence: Did price break a level, but CVD failed to follow? (Fakeout warning).
Extremes: Are there Red/Green dots appearing? If yes, am I chasing a trade too late?
这是一套完整的线性回归 CVD (Linear Regression CVD) 指标的使用说明书和简介。你可以把它保存下来,作为你的交易系统参考文档。
📊 线性回归 CVD (Linear Regression CVD) —— 交易员手册
1. 指标简介 (Introduction)
核心理念:
普通的 CVD(累积成交量差)往往噪音很大,线条锯齿状严重,导致交易者难以看清真正的资金流向趋势。本指标通过线性回归算法 (Linear Regression) 对 CVD 进行平滑处理,并结合标准差通道 (Standard Deviation Channel),试图解决两个核心问题:
资金流向的真实趋势是什么?(排除噪音)
当前的情绪是否过热?(通过通道判定)
适用市场:
加密货币合约 (BTC, ETH 等永续合约) —— 效果最佳
股票、外汇 (需有成交量数据)
适用周期:
日内短线:1分钟、5分钟、15分钟(捕捉快速的资金进出)。
趋势波段:1小时、4小时(判断主力资金的大方向)。
2. 视觉元素说明 (Visual Guide)
当你加载指标后,你会看到以下几个部分:
A. 彩色主线 (The LinReg Line)
形态:一条平滑的粗线。
含义:资金流向的**“平均趋势”**。
颜色:
🟢 绿色:资金流向趋势向上(买盘主导)。
🔴 红色:资金流向趋势向下(卖盘主导)。
B. 灰色背景细线 (Raw CVD)
形态:一条充满锯齿的灰色细线,在主线周围波动。
含义:原始的、实时的累积成交量。它反应了当下的每一根K线的实际买卖差额。
C. 蓝色背景通道 (The Channel)
形态:包裹在主线周围的深蓝色带状区域。
含义:“正常波动范围”。
基于线性回归的 2倍标准差计算。
如果灰色细线在通道内运行,说明市场情绪稳定,多空力量均衡。
D. 信号点 (The Dots)
🟢 绿点 (底部出现):原始 CVD 向上突破了通道上轨。代表极度贪婪 / 抢筹。
🔴 红点 (底部出现):原始 CVD 向下跌破了通道下轨。代表极度恐慌 / 抛售。
3. 实战交易策略 (Trading Strategies)
策略一:趋势确认 (Trend Following)
这是最基础的顺势用法。
做多信号:
价格处于上升趋势(如在均线之上)。
CVD 主线由红变绿,且持续向上倾斜。
操作:这确认了价格的上涨有真金白银的买盘支持,可以持有或加仓。
做空信号:
价格处于下降趋势。
CVD 主线由绿变红,且持续向下倾斜。
操作:确认卖盘主导,价格下跌是健康的。
策略二:背离交易 (Divergence) —— 胜率最高的用法
寻找“主力资金”与“价格”不一致的地方。
顶背离 (看跌):
价格创出了新高 (Higher High)。
CVD 主线却没有创新高,或者形成更低的高点 (Lower High)。
含义:价格在涨,但买入的资金在减少。这通常是主力在通过限价单悄悄出货,或者是买盘枯竭。
操作:准备做空,或多单止盈。
底背离 (看涨):
价格创出了新低 (Lower Low)。
CVD 主线却形成了更高的低点 (Higher Low)。
含义:价格在跌,但卖出的资金在减少,或者有大资金在底部通过挂单吸筹 (Absorption)。
操作:准备做多,或空单止盈。
策略三:极端情绪反转 (Mean Reversion)
利用红绿点判断短期的超买超卖。
做多机会 (反弹):
价格快速下跌,甚至暴跌。
指标底部出现密集的红点 (Downside Extension)。
含义:恐慌盘被杀出来了 (Capitulation),市场短期内无可再卖。
操作:等待K线出现反转形态(如长下影线)后尝试博反弹。
做空机会 (回调):
价格快速拉升(垂直上涨)。
指标底部出现密集的绿点 (Upside Extension)。
含义:大量的散户在追涨 (FOMO),透支了买盘动能。
操作:等待上涨停滞后尝试做空。
4. 关键注意事项 (Limitations)
数据源区别:
TradingView 的普通 Volume 是基于 K 线的近似计算(Close > Open 算买,Close < Open 算卖)。
这与专业的 Orderflow 软件(如 Exocharts)使用的逐笔 Tick 数据有一定误差,但在 1小时/4小时 级别上,趋势方向基本一致。
建议:如果你是做合约,请务必加载 合约图表(如 BTCUSDT.P),不要用现货图表看 CVD。
红绿点的陷阱:
不要一看到绿点就做空! 在超级大单边行情(比如牛市主升浪)中,绿点会连续出现,价格会一直涨。
红绿点必须配合 关键支撑/阻力位 使用。如果在“半空中”出现绿点,往往意味着趋势加速,而不是反转。
参数调整:
默认 LinReg Length = 20。
如果你觉得反应太慢,可以改为 10 或 14。
如果你觉得假信号太多,可以改为 50,但这会牺牲灵敏度。
5. 快速检查清单 (Checklist)
在开单前,看一眼 CVD:
颜色:CVD 是绿的还是红的?和我想做的方向一致吗?
斜率:CVD 是在加速上升/下降,还是开始变平了?
背离:价格破位了,CVD 跟着破位了吗?如果没跟,就是假突破。
极值:有没有出现红点/绿点?如果出现了,是不是应该等回调再进场?
Open-source script
In true TradingView spirit, the creator of this script has made it open-source, so that traders can review and verify its functionality. Kudos to the author! While you can use it for free, remember that republishing the code is subject to our House Rules.
成长学习,巩固发展
Disclaimer
The information and publications are not meant to be, and do not constitute, financial, investment, trading, or other types of advice or recommendations supplied or endorsed by TradingView. Read more in the Terms of Use.