OPEN-SOURCE SCRIPT
Updated Average Body Range
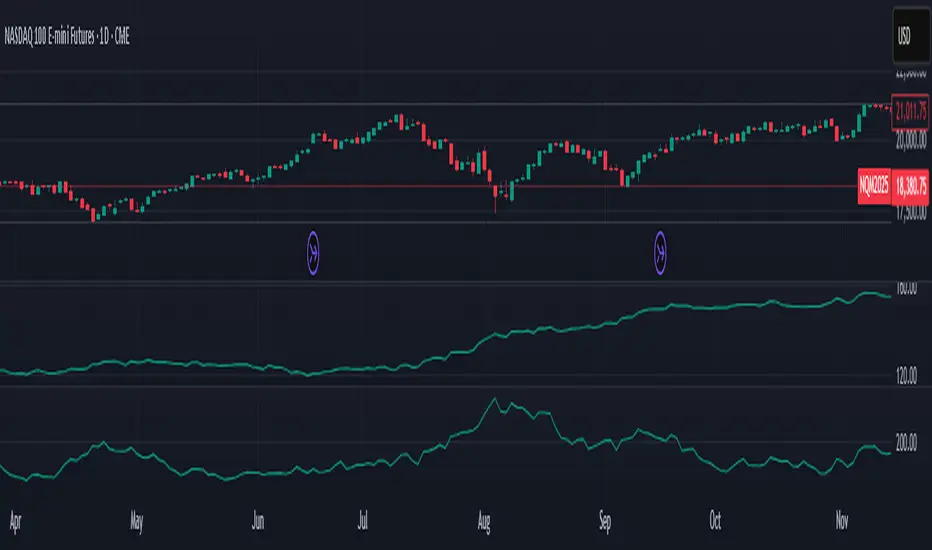
The Average Body Range (ABR) indicator calculates the average size of a candle's real body over a specified period. Unlike the traditional Average Daily Range (ADR), which measures the full range from high to low, the ABR focuses solely on the absolute difference between the open and close of each bar. This provides insight into market momentum and trading activity by reflecting how much price is actually moving from open to close, not just in total.
This indicator is especially useful for identifying:
Periods of strong directional movement (larger body sizes)
Low-volatility or indecisive markets (smaller body sizes)
Changes in trend conviction or momentum
Customization:
Length: Number of bars used to compute the average (default: 14)
Use ABR to enhance your understanding of price behavior and better time entries or exits based on market strength.
Release Notes
Average Body Range (ABR)Description:
The Average Body Range (ABR) indicator calculates the average size of a candle's real body over a specified period. Unlike the traditional Average Daily Range (ADR), which measures the full range from high to low, the ABR focuses solely on the absolute difference between the open and close of each bar. This provides insight into market momentum and trading activity by reflecting how much price is actually moving between open to close, not just in total.
This indicator is especially useful for identifying:
Periods of strong directional movement (larger body sizes)
Low-volatility or indecisive markets (smaller body sizes)
Changes in trend conviction or momentum
Customization:
Length: Number of bars used to compute the average (default: 14)
Use ABR to enhance your understanding of price behavior and better time entries or exits based on market strength.
Notes:
I primarily use the 200 period ABR on the daily to determine the expected range for the day. Since I'm focused on where the market closes, the ABR — which captures the average open-to-close distance — provides a much more realistic measure of expected price movement than ATR or ADR, which tend to overemphasize intraday extremes. This approach helps me stay grounded in the market's typical behavior (trade along typical ranges) and improve trade planning around probable range limits.
Open-source script
In true TradingView spirit, the creator of this script has made it open-source, so that traders can review and verify its functionality. Kudos to the author! While you can use it for free, remember that republishing the code is subject to our House Rules.
Disclaimer
The information and publications are not meant to be, and do not constitute, financial, investment, trading, or other types of advice or recommendations supplied or endorsed by TradingView. Read more in the Terms of Use.