OPEN-SOURCE SCRIPT
Market Structure [TFO]
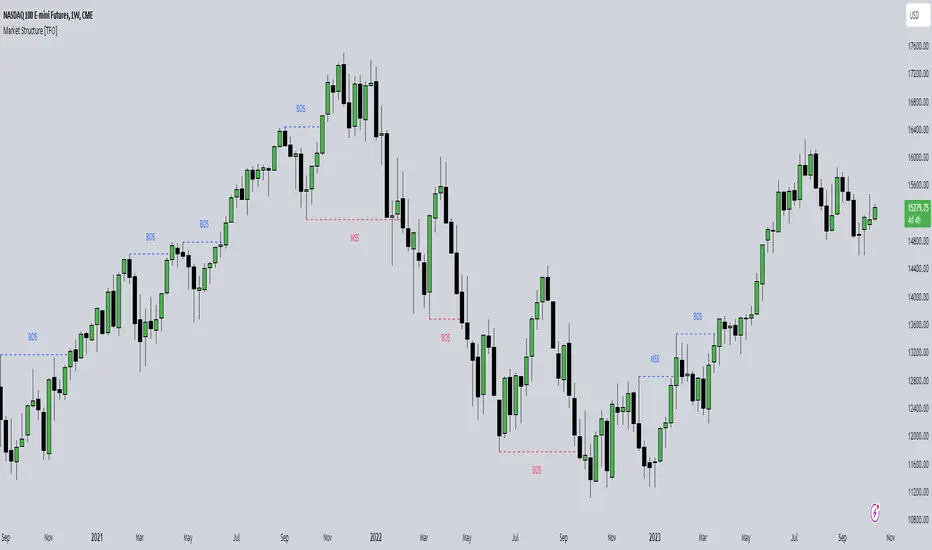
The purpose of this indicator is to provide a simple approach to Market Structure. When price is closing over swing highs, we may categorize that as bullish structure; and when price is closing below swing lows, we may categorize that as bearish structure.

We can easily find swing highs and lows via the following built-in Pine Script functions:
Pine Script®
We can pass in our Pivot Strength parameter to determine the size/significance of these pivots. The lowest value of 1 will validate a swing high when a given high is larger than that of 1 bar to the left and right of it. A pivot strength of 3, for example, would validate a swing high only when a high is larger than that of the 3 bars to the left and right of it, making it much more selective.

In any case, we can simply track the most recent swing highs and lows and check for when price through them. Enabling the Show Pivots option will mark all the swing highs and lows that are being considered for future structure breaks.

If the trend is bearish and we begin closing over swing highs, that would mark a Market Structure Shift (MSS). If the trend is already bullish and we are closing over swing highs, that would mark a Break of Structure (BOS), and vice versa for bearish conditions. MSS essentially signifies reversals in Market Structure while BOS signifies continuations.

Users may also create alerts for Any/Bull/Bear BOS or MSS. Simply create a new alert, select this indicator, and select the desired BOS or MSS criteria.
We can easily find swing highs and lows via the following built-in Pine Script functions:
ta.pivothigh()
ta.pivotlow()
We can pass in our Pivot Strength parameter to determine the size/significance of these pivots. The lowest value of 1 will validate a swing high when a given high is larger than that of 1 bar to the left and right of it. A pivot strength of 3, for example, would validate a swing high only when a high is larger than that of the 3 bars to the left and right of it, making it much more selective.
In any case, we can simply track the most recent swing highs and lows and check for when price through them. Enabling the Show Pivots option will mark all the swing highs and lows that are being considered for future structure breaks.
If the trend is bearish and we begin closing over swing highs, that would mark a Market Structure Shift (MSS). If the trend is already bullish and we are closing over swing highs, that would mark a Break of Structure (BOS), and vice versa for bearish conditions. MSS essentially signifies reversals in Market Structure while BOS signifies continuations.
Users may also create alerts for Any/Bull/Bear BOS or MSS. Simply create a new alert, select this indicator, and select the desired BOS or MSS criteria.
Open-source script
In true TradingView spirit, the creator of this script has made it open-source, so that traders can review and verify its functionality. Kudos to the author! While you can use it for free, remember that republishing the code is subject to our House Rules.
Disclaimer
The information and publications are not meant to be, and do not constitute, financial, investment, trading, or other types of advice or recommendations supplied or endorsed by TradingView. Read more in the Terms of Use.