OPEN-SOURCE SCRIPT
Horizontal EMA
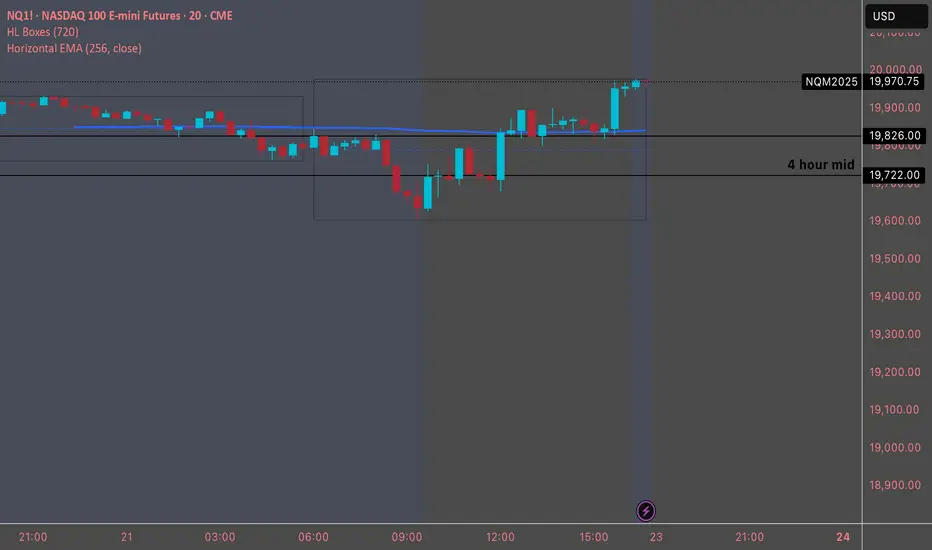
Designed to plot a horizontal Exponential Moving Average (EMA) line on a TradingView chart. The script allows users to specify the period and source for the EMA calculation. The line remains fixed at the calculated EMA value, providing a visual reference for the trend over the specified period. The script uses version 5 of Pine Script and draws a blue horizontal line at the EMA value on the chart, updating as new data is available.
Open-source script
In true TradingView spirit, the creator of this script has made it open-source, so that traders can review and verify its functionality. Kudos to the author! While you can use it for free, remember that republishing the code is subject to our House Rules.
Disclaimer
The information and publications are not meant to be, and do not constitute, financial, investment, trading, or other types of advice or recommendations supplied or endorsed by TradingView. Read more in the Terms of Use.