OPEN-SOURCE SCRIPT
Dual EMA Trend Ribbon (Multi-Timeframe Trend Confirmation)
Dual EMA Trend Ribbon (Multi-Timeframe Trend Confirmation)
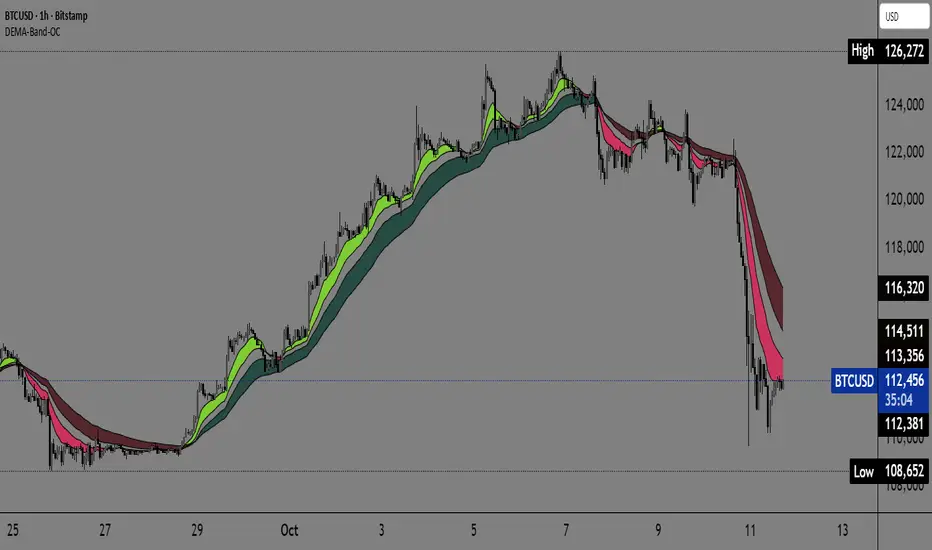
This Pine Script indicator creates a visually clear representation of trend direction using two overlaid Exponential Moving Average (EMA) Ribbons, which allows traders to assess both short-term and medium-term momentum at a glance.
How It Works:
The indicator plots two separate EMA ribbons, each calculated using a distinct set of periods, simulating a multi-timeframe approach on a single chart:
Inner (Fast) Ribbon (Defaults 10/30): Represents the fast-moving, short-term trend.
Green: Fast EMA 1 > Slow EMA 1 (Short-term Bullish)
Red: Fast EMA 1 < Slow EMA 1 (Short-term Bearish)
Outer (Slow) Ribbon (Defaults 40/50): Represents the slower, medium-term trend.
Darker Green/Red: Indicates the overall, underlying market bias.
How to Use:
Strong Trend Confirmation: A strong signal occurs when both ribbons are aligned (e.g., both are Green). This suggests that short-term momentum aligns with the medium-term bias.
Trend Weakness/Reversal: Pay attention when the two ribbons cross or when the fast ribbon changes color against the slow ribbon's color (e.g., fast ribbon turns Red while the slow ribbon remains Green). This often signals a temporary pullback or potential reversal of the underlying trend.
Settings: Users can easily adjust the four input periods (Fast EMA 1, Slow EMA 1, Fast EMA 2, Slow EMA 2) to customize the sensitivity to any trading style or asset.
Open-source script
In true TradingView spirit, the creator of this script has made it open-source, so that traders can review and verify its functionality. Kudos to the author! While you can use it for free, remember that republishing the code is subject to our House Rules.
Free telegram channel t.me/alexmasterforex
Disclaimer
The information and publications are not meant to be, and do not constitute, financial, investment, trading, or other types of advice or recommendations supplied or endorsed by TradingView. Read more in the Terms of Use.