OPEN-SOURCE SCRIPT
Updated Rolling Performance Metrics Table
Rolling Performance Metrics Table
A clean, customizable table overlay that displays rolling performance metrics across multiple time periods. Perfect for quickly assessing price momentum and performance trends at a glance.
FEATURES:
- Displays performance across 5 time periods: 1 Week, 3 Month, 6 Month, 1 Year, and 2 Year
- Shows historical price at the start of each period
- Calculates both absolute price change and percentage change
- Color-coded results: Green for positive performance, Red for negative performance
- Fully transparent design with no background or borders - text floats cleanly over your chart
- Customizable table position (9 placement options)
DISPLAY COLUMNS:
1. Period - The lookback timeframe
2. Price - The historical price at the start of the period
3. Change (Value) - Absolute price change from the period start
4. Change (%) - Percentage return over the period
CUSTOMIZATION:
- Adjust the number of bars for each period (default: 1 Week = 5 bars, 3 Month = 63 bars, 6 Month = 126 bars, 1 Year = 252 bars, 2 Year = 504 bars)
- Choose from 9 table positions: Top, Middle, Bottom combined with Left, Center, Right
- Default position: Middle Left
USAGE:
Perfect for traders who want to quickly assess momentum across multiple timeframes. The transparent overlay design ensures minimal obstruction of chart analysis while providing critical performance data at a glance.
NOTE:
- The table only appears on the last bar of your chart
- Customize bar counts in settings to match your specific timeframe needs (e.g., daily vs hourly charts)
- "N/A" appears when historical data is insufficient for the selected period
Release Notes
Rolling Performance Metrics - Quick ViewDisplays a transparent floating table showing stock performance across 5 key time periods:
- 1 Week, 3 Month, 6 Month, 1 Year, and 2 Year lookback windows
For each period, the table shows:
- Historical starting price
- Absolute price change (in currency units)
- Percentage return (color-coded: green = positive, red = negative)
Perfect for quick momentum analysis and multi-timeframe performance comparison at a glance. The borderless, transparent design keeps your chart clean while providing essential performance metrics.
```
Or if you want an even shorter version:
```
Clean performance table showing price changes and returns across 5 timeframes (1W to 2Y). Color-coded percentage gains (green) and losses (red) for quick visual analysis. Transparent overlay with customizable positioning.
Release Notes
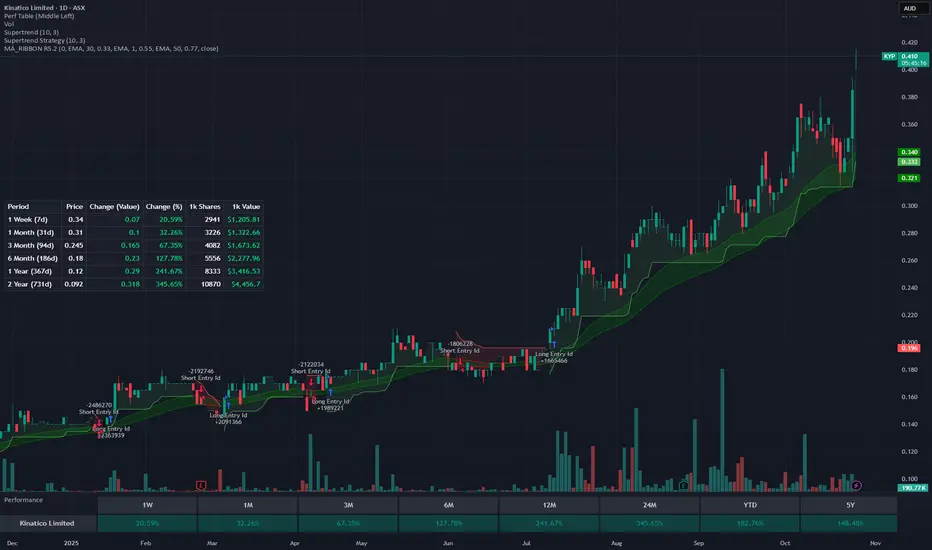
# Rolling Performance Metrics Table## Overview
A TradingView Pine Script indicator that displays a comprehensive performance metrics table showing rolling returns across multiple time periods. Uses TradingView's official **ValueAtTime library** to match their native Performance indicator calculations exactly.
## Features
- **Calendar-Based Periods**: 1 Week, 1 Month, 3 Month, 6 Month, 1 Year, 2 Year with actual day counts displayed (e.g., "1 Month (31d)")
- **Performance Metrics**:
- Starting price for each period
- Absolute change in value
- Percentage change
- Hypothetical shares purchased with $1,000
- Current value of that $1,000 investment
- **Visual Indicators**: Color-coded changes (green for gains, red for losses) with faint grid lines
- **Data Window Export**: All metrics available in TradingView's Data Window for copying
- **Customizable**: Adjustable table position and display options
## Settings
| Setting | Default | Description |
|---------|---------|-------------|
| Table Position | Middle Left | Choose from 9 positions (Top/Middle/Bottom × Left/Center/Right) |
| Show in Data Window | Enabled | Makes all data copyable from TradingView's Data Window |
## Table Columns
1. **Period** - Time period with actual calendar days (e.g., "1 Week (7d)", "1 Month (31d)")
2. **Price** - Stock price at the start of the period
3. **Change (Value)** - Absolute price change since period start
4. **Change (%)** - Percentage change since period start
5. **1k Shares** - Number of shares $1,000 would buy at period start price
6. **1k Value** - Current value of those shares at today's price
## Technical Details
### ValueAtTime Library
Uses TradingView's official `ValueAtTime` library (v2) - the same library powering their native Performance indicator:
```pine
import TradingView/ValueAtTime/2 as VAT
```
**Timeframes**: `"1W", "1M", "3M", "6M", "12M", "24M"`
The library handles complex calendar arithmetic automatically:
- Different month lengths (28-31 days)
- Leap years
- Trading days vs calendar days
- Weekend/holiday adjustments
**Day counts** are calculated from the timestamps returned by ValueAtTime, showing actual calendar days between today and the historical date for transparency.
## Version
- **Pine Script Version**: v6
- **Author**: bobmcallan@gmail.com
- **Type**: Overlay indicator
Open-source script
In true TradingView spirit, the creator of this script has made it open-source, so that traders can review and verify its functionality. Kudos to the author! While you can use it for free, remember that republishing the code is subject to our House Rules.
Disclaimer
The information and publications are not meant to be, and do not constitute, financial, investment, trading, or other types of advice or recommendations supplied or endorsed by TradingView. Read more in the Terms of Use.