Autonomous LSTM [Noldo]
Feature Layer 1 : Formulation :
- The Autonomous LSTM adaptive period equation is a multivariate equation created by averaging a table based on market weights and optimizing it for each time period, by specially Artificial Neural Networks (ANN) training and taking note of the instruments chosen from Foreign exchange instruments, Stock markets , Futures and Commodities , Interest Rates and Yields all over the Global Markets.
Market weights and liquidities were taken into consideration and included in the calculations.
Feature Layer 2: Forecast Algorithm :
- When we apply only the first item, we only get the buy and sell signals in reverse.
In other words, since we measure the expectation, the positive signal informs the bear market and the negative scenario informs the bull market.
If we only act according to the expectations market, our system will be very sensitive.
When we associate this with real prices, both our accuracy increases and the reverse market returns to the normal market.
In other words, as in the indicators with standard average, the upward crosses are buy and the downward crosses are sell signal.
Examples:
a -) The normal deep learning script (ANN), which is only created according to expectations:
Unlike standard market, it gives reverse signals.
Original script :

b-) Script with Forecast Algorithm but it only uses valid and standard periods for certain instruments :
Original script :
![ANN Forecast Stochastic Oscillator [Noldo]](https://s3.tradingview.com/y/YYw2DY9i_mid.png)
Feature Layer 3 : Composite of Two Layers : Adaptive Period (Length) Algorithm
- This layer is the most important layer.
Outputs the period.
It adjusts itself to market conditions and provides a more agile trading environment under all circumstances.
Display of smart period function and standard period :
- Where the market is stagnant, the period increases automatically and reduces unnecessary trade, while in trendy markets the period decreases automatically and allows to see positions first.
The degree of stagnation of the instrument concerned is not calculated solely by volatility.
We may perceive this in relation to several factors, but yes volatility is one of these factors.
- When we put the script system under the MACD (Moving Average Convergence Divergence) roof, I did the tests.
Where both averages were positive, they could report accurate harsh trend news, or vice versa.
But I decided to give it up and put it on the Stochastic Money Flow Index.
- First of all , Stochastic Money Flow Index function takes the volume into account.
The reason for this is a very important factor, which is naturally contained in the structure of High - Low conditions related codes.
And by using this factor, it could be superfast adaptive in both stagnant and trendy markets.
Feature Layer 4 : High - Low Selection Algorithm
- The High-Low Selection Algorithm does not depend on a specific period but scans all periods backwards.(Lookback Function - Lkb )
Outputs the lowest or highest values in the specified new period.
This algorithm was written by me with the concern that if everyone trades according to the same threshold values, it will cause problems and choosing between values of the whole period length will slow down the signals.
This algorithm consists of two functions.
a - Lkb (Lookback Function) :
- The lookback function scans back all periods from 0 to Smart Period bars at the same time.
In order to show the effect of the function, it was done between 0 and 84 bars.
However, the scan period of the function is normally at the same time: 0 to adaptive period time.
If the adaptive period includes a fractional day, it can also scan it.
There is no need to be an integer.
All functions are written to make mutable variables appropriate.
And what this function will scan depends on the second feature.
The special selection algorithm is in this function.And the output is given in this function.
b-) High - Low Selection Algorithm
- Outputs the lowest or highest values in the specified new period.
This function allows you to select the most advantageous low or high values, even though the adaptive period remains the same.
And the signals are even more accurate.
- This is a comparison of the High-Low selection algorithm and the Function: Stochastic Money Flow Index in the standard period.
For the codes of the Stochastic Money Flow Index function:
Speed may not be clear here.
So let's take a look at on chart.
So I would like to show a comparison values of the standard and special selection algorithms on Standard Highest - Lowest Function (All effort goes to RicardoSantos)
Note: This function is the standard function and freed from integer loads.
Blue = Function Highest - Lowest (length = 10 )
Yellow = Smart High-Low Selection Algorithm (length = 10 )
You can better observe the different results in the same period on the chart.
***
4 layers are interdependent.
And when the inter-layer operations are completed, output is given.
*** - Usage of Autonomous LSTM
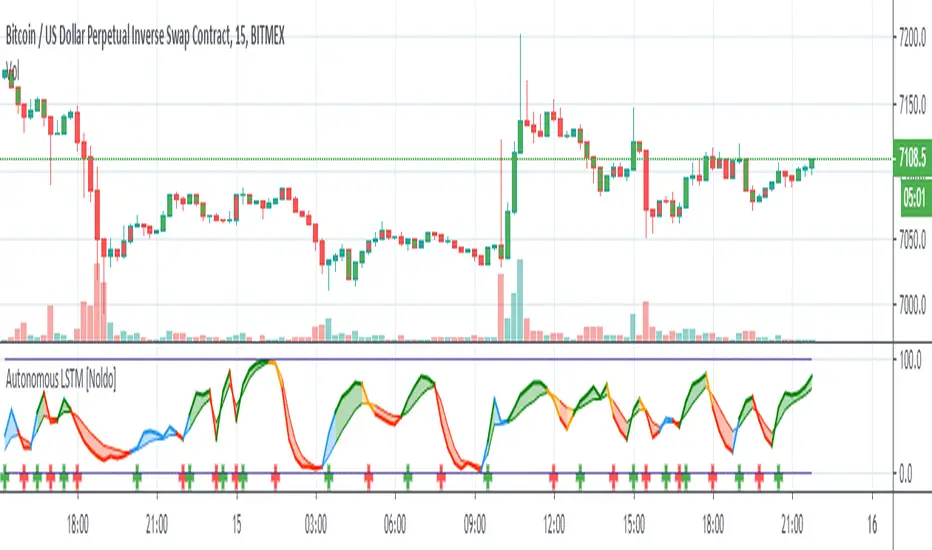
Plot Rules
- Blue Zones = Crossover condition where the average of long and short lines is less than 50.
- Orange Zones = Crossunder condition where long and short lines averages more than 50.
- Green Zones = Crossover condition where the average of long and short lines is greater than 50.
- Red Zones = Crossunder condition where long and short lines averages less than 50.
*** Autonomous LSTM Settings :
*It is just the barcolor to be colored according to the crossover and crossunder conditions or not (I / 0) option.
*** Autonomous LSTM Alerts :
*As an alert, it only reports crossover and crossunder status as "Long Signal" and "Short Signal" as a warning after the first bar closure.
*** CONCLUSION :
- Autonomous LSTM Designed to be used in any time frame.
- Does not repaint in any time frame.
- Script is independent of constant coefficients.No period adjustment is necessary.
- Each layer transfers the information in its own layer to the next layer and the results are reflected in the Stochastic Money Flow Index function built on the resultant.
Regards.
Invite-only script
Only users approved by the author can access this script. You'll need to request and get permission to use it. This is typically granted after payment. For more details, follow the author's instructions below or contact Noldo directly.
TradingView does NOT recommend paying for or using a script unless you fully trust its author and understand how it works. You may also find free, open-source alternatives in our community scripts.
Author's instructions
Let's watch the algorithm's movements together from my website !
bit.ly/4j4sANJ
Email : contact@noldoresearch.com
Disclaimer
Invite-only script
Only users approved by the author can access this script. You'll need to request and get permission to use it. This is typically granted after payment. For more details, follow the author's instructions below or contact Noldo directly.
TradingView does NOT recommend paying for or using a script unless you fully trust its author and understand how it works. You may also find free, open-source alternatives in our community scripts.
Author's instructions
Let's watch the algorithm's movements together from my website !
bit.ly/4j4sANJ
Email : contact@noldoresearch.com