PROTECTED SOURCE SCRIPT
HMA High/Low Band - Trend Color
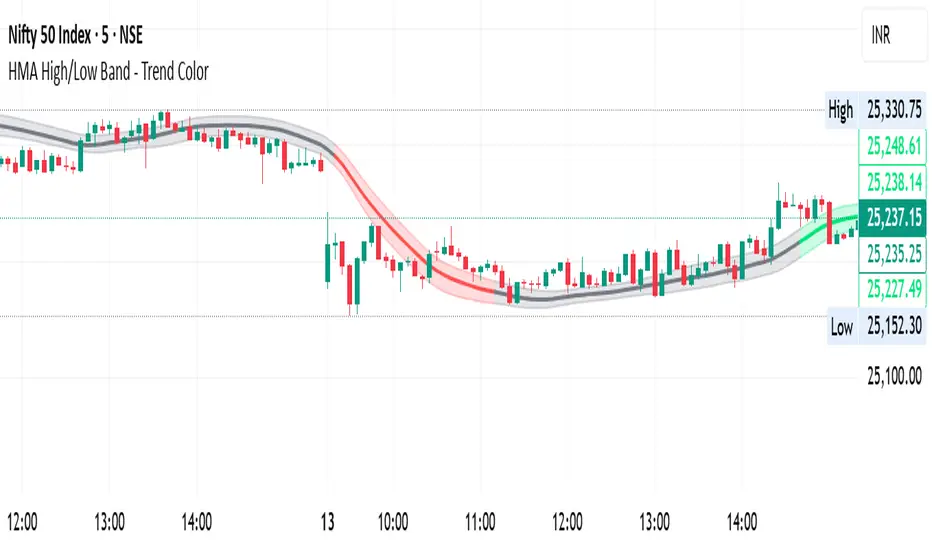
HMA High/Low Band Trend
Visualize market trends clearly with a single Hull Moving Average (HMA) and dynamic high/low bands. The indicator colors the HMA and its bands based on trend direction:
Green = Uptrend
Red = Downtrend
Gray = Sideways
The band adjusts dynamically to price action, giving a clear view of trending and sideways markets without cluttering your chart. Ideal for traders who want a smooth trend filter with instant visual cues.
Protected script
This script is published as closed-source. However, you can use it freely and without any limitations – learn more here.
Disclaimer
The information and publications are not meant to be, and do not constitute, financial, investment, trading, or other types of advice or recommendations supplied or endorsed by TradingView. Read more in the Terms of Use.