OPEN-SOURCE SCRIPT
Updated KJS-- Gost Pivot MA
KJS Ghost Pivot Moving Average
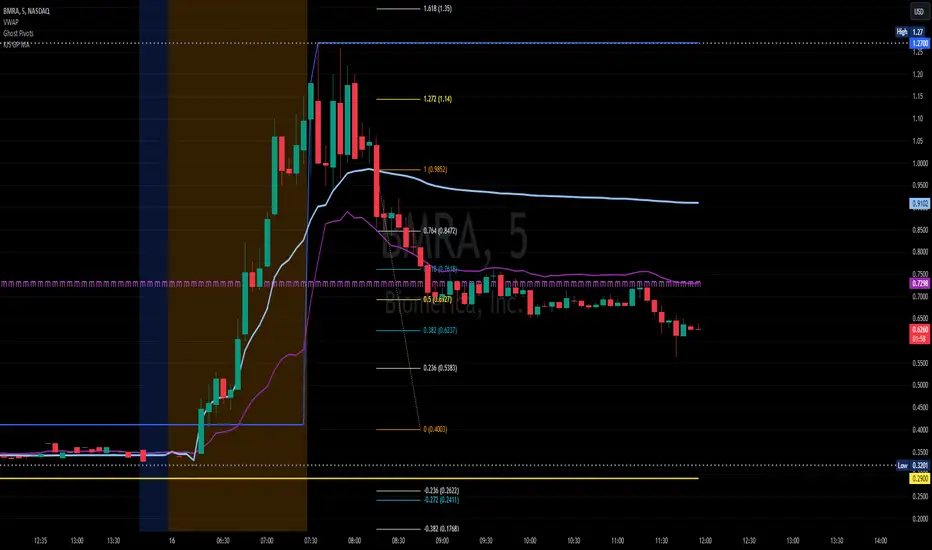
This indicator calculates a "Ghost Pivot" by estimating where the monthly pivot level would be if the current candle's close represented the end of the month. The calculation uses:
• The current month's high and low from regular trading hours (RTH).
• The current candle's close, which includes both premarket and after-hours data.
It also smooths the ghost pivot using a customizable simple moving average (SMA).
Features:
• Plots the current month's high (blue) and low (yellow) based on RTH data.
• Calculates and plots a dynamic pivot (purple line) as the average of the monthly high, low, and current close (HLC3).
• Includes a customizable SMA length for smoother pivot tracking (default: 3).
This indicator helps traders anticipate potential monthly pivot levels in real-time while visualizing key support and resistance areas.
Release Notes
KJS Ghost Pivot Moving AverageThis indicator calculates a “Ghost Pivot" by estimating where the monthly pivot level would be if the current candle’s close represented the end of the month. The calculation uses:
It also smooths the ghost pivot using a customizable simple moving average (SMA).
Features:
This indicator helps traders anticipate potential monthly pivot levels in real-time while visualizing key support and resistance areas.
Release Notes
Update to Pine Script v6Open-source script
In true TradingView spirit, the creator of this script has made it open-source, so that traders can review and verify its functionality. Kudos to the author! While you can use it for free, remember that republishing the code is subject to our House Rules.
Disclaimer
The information and publications are not meant to be, and do not constitute, financial, investment, trading, or other types of advice or recommendations supplied or endorsed by TradingView. Read more in the Terms of Use.
Open-source script
In true TradingView spirit, the creator of this script has made it open-source, so that traders can review and verify its functionality. Kudos to the author! While you can use it for free, remember that republishing the code is subject to our House Rules.
Disclaimer
The information and publications are not meant to be, and do not constitute, financial, investment, trading, or other types of advice or recommendations supplied or endorsed by TradingView. Read more in the Terms of Use.