OPEN-SOURCE SCRIPT
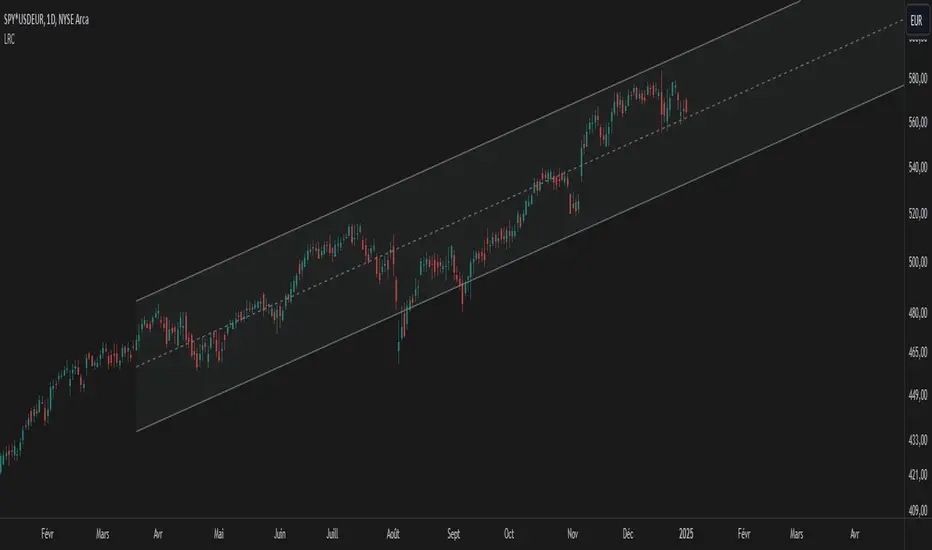
Updated Linear Regression Channel Ultimate

Key Features and Benefits
Why Logarithmic Scale Matters
The logarithmic scale option is a game-changer for analyzing assets with exponential growth or high volatility. Unlike linear scales, log scales represent percentage changes consistently across the price range. This allows for:
How It Works
Understanding Touch Count vs Volume
Practical Applications
This Linear Regression Channel indicator combines powerful statistical analysis with flexible visualization options, making it an invaluable tool for traders and analysts across various timeframes and markets. Its unique features, especially the logarithmic scale and activity profiling, provide deeper insights into market behavior and potential turning points.
- Logarithmic scale option for improved analysis of long-term trends and volatile markets
- Activity-based profiling using either touch count or volume data
- Customizable channel width and number of profile fills
- Adjustable number of most active levels displayed
- Highly configurable visual settings for optimal chart readability
Why Logarithmic Scale Matters
The logarithmic scale option is a game-changer for analyzing assets with exponential growth or high volatility. Unlike linear scales, log scales represent percentage changes consistently across the price range. This allows for:
- Better visualization of long-term trends
- More accurate comparison of price movements across different price levels
- Improved analysis of volatile assets or markets experiencing rapid growth
How It Works
- The indicator calculates a linear regression line based on the specified period
- Upper and lower channel lines are drawn at a customizable distance from the regression line
- The space between the channel lines is divided into a user-defined number of levels
- For each level, the indicator tracks either:
- The number of times price touches the level (touch count method)
- The total volume traded when price is at the level (volume method) - The most active levels are highlighted based on this activity data
Understanding Touch Count vs Volume
- Touch count method: Useful for identifying key support/resistance levels based on price action alone
- Volume method: Provides insight into levels where the most trading activity occurs, potentially indicating stronger support/resistance
Practical Applications
- Trend identification and strength assessment
- Support and resistance level discovery
- Entry and exit point optimization
- Volume profile analysis for improved market structure understanding
This Linear Regression Channel indicator combines powerful statistical analysis with flexible visualization options, making it an invaluable tool for traders and analysts across various timeframes and markets. Its unique features, especially the logarithmic scale and activity profiling, provide deeper insights into market behavior and potential turning points.
Release Notes
Small bugs fixedRelease Notes
Small bugs fixedRelease Notes
Minor Update: Small bugs fixedRelease Notes
Major Update, The script has been updated to fix multiple logic bugs and improve its functionality. Open-source script
In true TradingView spirit, the creator of this script has made it open-source, so that traders can review and verify its functionality. Kudos to the author! While you can use it for free, remember that republishing the code is subject to our House Rules.
Plan the trade ⚡ Trade the plan
Disclaimer
The information and publications are not meant to be, and do not constitute, financial, investment, trading, or other types of advice or recommendations supplied or endorsed by TradingView. Read more in the Terms of Use.
Open-source script
In true TradingView spirit, the creator of this script has made it open-source, so that traders can review and verify its functionality. Kudos to the author! While you can use it for free, remember that republishing the code is subject to our House Rules.
Plan the trade ⚡ Trade the plan
Disclaimer
The information and publications are not meant to be, and do not constitute, financial, investment, trading, or other types of advice or recommendations supplied or endorsed by TradingView. Read more in the Terms of Use.