Advanced Trend Panel v3.0Advanced Trend Panel v3.0 is a comprehensive indicator that analyzes market trends across multiple timeframes. It combines long-term and short-term EMAs, ADX for trend strength, RSI, Volume Profile (POC), and volume comparisons. The script calculates trend duration (in bars or time units) and provides a higher-timeframe forecast for context. All data is displayed in a customizable table with adjustable position and text size.
Key Features:
- Long/Short Trend States with Duration
- Trend Strength via ADX
- Price vs. POC
- RSI Overbought/Oversold
- Volume Analysis
- Higher TF Trend Forecast
- Optional Plots for EMAs and POC Line
Customize inputs to fit your strategy. This script is for educational purposes and not financial advice. Use at your own risk.
POC

Multi Ranges Volume Distribution [LuxAlgo]The Multi Ranges Volume Distribution tool allows traders to see the volume distribution by price for three different timeframes simultaneously. Each distribution can report the total amount of accumulated volume or the accumulated buy/sell volume separately.
Levels are displayed at the top and bottom of each timeframe's range, as well as the POC or level with the most volume.
🔶 USAGE
By default, the tool displays daily, weekly, and monthly volume distributions, highlighting the accumulated volume within each row.
Each distribution shows the volume at each price, as well as three lines: the top and bottom prices, and the price at which the most volume was traded.
The reported accumulated volume can be useful for highlighting which price areas are of the most interest to traders, with the specific timeframe specifying whether this interest is long-term or short-term.
🔹 Timeframes & Rows
Traders can adjust the timeframe and the number of rows for each volume distribution.
This is useful for multi-timeframe analysis of volume at the same price levels, or for obtaining detailed data within the same timeframe.
The chart above shows three volume distributions with the same monthly timeframe but a different number of rows; each is more detailed than the previous one.
🔹 Total vs Buy & Sell Volume
Traders can choose to display either the total volume or the buy and sell volumes.
As we can see on the above chart, the background of each row uses a gradient that is a function of the delta between the buy and sell volumes.
This is useful to determine which areas attract buyers and sellers.
🔶 SETTINGS
Volume Display: Select between total volume and buy and sell volume.
Distance between each box: Adjust the spacing of the volume distributions.
Period A: Select a timeframe and the number of rows.
Period B: Select a timeframe and the number of rows.
Period C: Select a timeframe and the number of rows.

Delta Volume Profile [BigBeluga]🔵Delta Volume Profile
A dynamic volume analysis tool that builds two separate horizontal profiles: one for bullish candles and one for bearish candles. This indicator helps traders identify the true balance of buying vs. selling volume across price levels, highlighting points of control (POCs), delta dominance, and hidden volume clusters with remarkable precision.
🔵 KEY FEATURES
Split Volume Profiles (Bull vs. Bear):
The indicator separates volume based on candle direction:
If close > open , the candle’s volume is added to the bullish profile (positive volume).
If close < open , it contributes to the bearish profile (negative volume).
ATR-Based Binning:
The price range over the selected lookback is split into bins using ATR(200) as the bin height.
Each bin accumulates both bull and bear volumes to form the dual-sided profile.
Bull and Bear Volume Bars:
Bullish volumes are shown as right-facing bars on the right side, colored with a bullish gradient.
Bearish volumes appear as left-facing bars on the left side, shaded with a bearish gradient.
Each bar includes a volume label (e.g., +12.45K or -9.33K) to show exact volume at that price level.
Points of Control (POC) Highlighting:
The bin with the highest bullish volume is marked with a border in POC+ color (default: blue).
The bin with the highest bearish volume is marked with a POC− color (default: orange).
Total Volume Density Map:
A neutral gray background box is plotted behind candles showing the total volume (bull + bear) per bin.
This reveals high-interest price zones regardless of direction.
Delta and Total Volume Summary:
A Delta label appears at the top, showing net % difference between bull and bear volume.
A Total label at the bottom shows total accumulated volume across all bins.
🔵 HOW IT WORKS
The indicator captures all candles within the lookback period .
It calculates the price range and splits it into bins using ATR for adaptive resolution.
For each candle:
If price intersects a bin and close > open , volume is added to the positive profile .
If close < open , volume is added to the negative profile .
The result is two side-by-side histograms at each price level—one for buyers, one for sellers.
The bin with the highest value on each side is visually emphasized using POC highlight colors.
At the end, the script calculates:
Delta: Total % difference between bull and bear volumes.
Total: Sum of all volumes in the lookback window.
🔵 USAGE
Volume Imbalance Zones: Identify price levels where buyers or sellers were clearly dominant.
Fade or Follow Volume Clusters: Use POC+ or POC− levels for reaction trades or breakouts.
Delta Strength Filtering: Strong delta values (> ±20%) suggest momentum or exhaustion setups.
Volume-Based Anchoring: Use profile levels to mark hidden support/resistance and execution zones.
🔵 CONCLUSION
Delta Volume Profile offers a unique advantage in market reading by separating buyer and seller activity into two visual layers. This allows traders to not only spot where volume was high, but also who was more aggressive. Whether you’re analyzing trend continuations, reversals, or absorption levels, this indicator gives you the transparency needed to trade with confidence.

Multi-Layer Volume Profile [BigBeluga]A powerful multi-resolution volume analysis tool that stacks multiple profiles of historical trading activity to reveal true market structure.
This indicator breaks down total and delta volume distribution across time at four adjustable depths — enabling traders to spot major POCs, volume shelves, and zones of price acceptance or rejection with unmatched clarity.
🔵 KEY FEATURES
Multi-Layer Volume Profiles:
Up to 4 separate volume profiles are stacked on the chart:
- Profile 1: Full period
- Profile 2: Half-length
- Profile 3: Quarter-length
- Profile 4: One-eighth-length
This layering helps traders assess confluence across different time horizons.
Custom Bin Resolution:
Each profile uses a customizable number of bins to control visual precision.
More bins = higher granularity, fewer bins = smoother profile.
Precise POC Highlighting:
The price level with the maximum traded volume in each profile is highlighted with a thick blue POC line.
This key level shows the most accepted price for each period.
Total and Delta Volume Labels:
- Total Volume: Displays cumulative volume over the profile period at the top of the profile box.
- Delta Volume: The difference between bullish and bearish volume is labeled at the base, showing directional pressure.
Positive delta = buyer dominance, negative delta = seller dominance.
Range Levels:
Each profile includes horizontal reference lines showing its high, low, bounds.
These edges often align with price reaction zones and become future resistance/support.
🔵 HOW IT WORKS
For each active profile, the indicator:
- Collects price range (highs/lows) across the selected `length`
- Divides this range into equal bins
- Assigns volume into bins based on candle close location
- Aggregates volume per bin to form the profile (polylines)
Separately tracks:
- Total volume (sum of all candles in range)
- Delta volume (sum of candle volumes: positive for bullish, negative for bearish closes)
Highlights the bin with maximum volume (POC)
and marks it with a thick blue line.
Adds auxiliary lines for high/low of each profile box
and total/delta volume tags with tooltips.
🔵 USAGE
Spot Acceptance Zones:
Thick, flat areas on the profile show where price stayed longest — ideal for building positions.
Identify Rejection Zones:
Thin volume areas signal price rejection and are often used for stop placement or entries.
Delta Confirmation:
Use strong positive/negative delta readings as directional bias confirmation for breakout trades.
Confluence Detection:
Watch for overlapping POCs between layers to identify extremely strong support/resistance zones.
🔵 CONCLUSION
Multi-Layer Volume Profile equips traders with a deeply layered market structure view.
Whether you're scalping intraday levels or analyzing macro support zones, the ability to stack volume perspectives, visualize directional delta, and anchor POCs provides an edge in anticipating market moves.
Use this tool to validate entries, confirm structure, and make more informed, volume-aware trading decisions.

Volume Profile + Price Action Strategy (POC-based)This indicator combines volume dynamics, price action patterns, and a simplified Point of Control (POC) to highlight potential high-probability trade zones.
🔍 Key Features
POC-Based Logic
Plots the POC from the most recent closed 10-minute candle as a horizontal level for intraday structure.
Volume Spike Detection
Highlights unusual activity based on volume compared to the average of the last N candles.
Effort vs. Result Analysis
Based on Wyckoff-inspired logic:
Absorption: Large volume, small body → possible buyer/seller absorption
False Move: Small volume, large body → potential fakeout
Price Action Recognition Detects:
Inside Bars
Pin Bars
Engulfing Candles
Signal Highlights
🔺 Absorption Signals (below bar, teal triangle)
🔻 False Move Signals (above bar, orange triangle)
🔷 POC Line
⚙️ Customizable Inputs
You can control signal sensitivity with these inputs:
Volume Spike Multiplier
Raise to filter only extreme volume spikes
→ Recommended: 2.0 to 3.0 for cleaner setups
Absorption Body Ratio
Lower to detect only very small bodies (tight candles)
→ Try 0.3 to 0.4 for stricter absorption logic
False Move Body Ratio
Raise to catch only large candles on low volume
→ Use 2.0+ to filter weak moves
🧠 How to Use
Use in confluence with:
Support/Resistance
VWAP or moving averages
Session opens/closes
Best on 10-minute charts, but adjustable
✅ Signal Tuning Tips
Want fewer but cleaner signals?
Increase Volume Spike Multiplier: 2.5+
Decrease Absorption Body Ratio: 0.3
Increase False Move Ratio: 2.0+
Want more frequent signals?
Lower Volume Multiplier: 1.2–1.5
Raise Absorption Ratio: 0.6+
Lower False Move Ratio: 1.2–1.4
📊 Recommended Timeframe
Optimized for 10-minute charts
Works intraday, especially around session opens and POC re-tests
⚠️ Disclaimer
This script is for educational and informational purposes only. It does not constitute financial advice or a recommendation to buy or sell any asset. Past performance is not indicative of future results. Always do your own research and consult a licensed financial advisor before making trading decisions.
Use at your own risk.

Dynamic Point of Control (POC)The Dynamic Point of Control (POC) indicator provides traders and analysts with insightful information about price levels, volume distribution, and sentiment within a specified historical range.
Instant Updates : POC recalculates with every new bar, keeping you ahead of the game.
Market Bias : Assess market sentiment through bullish volume share.
Customization : Tailor inputs to match your unique trading strategy.
Chart Presence : See POC and related data graphically on your price chart.
How to Use :
Traders can use the Dynamic POC indicator to identify Point of Control price level, understand volume distribution, and gauge market sentiment. The indicator's visual cues and customizable parameters make it a valuable tool for technical analysis and decision-making.

HTF Candle Volume Thermometer [ChartPrime]The HTF Candle Volume Thermometer is a powerful volume heatmap tool that visualizes higher timeframe candle volume distributions directly on the chart. It helps traders identify key price levels where liquidity is concentrated, allowing for more informed trading decisions.
⯁ KEY FEATURES
Higher Timeframe Volume Mapping
Uses higher timeframe (HTF) candles to create a heatmap of volume distribution within each candle.
Dynamic Volume Heatmap
Colors each HTF candle background green for bullish and red for bearish, with a gradient heat overlay highlighting volume concentration.
Max Volume Point Identification
Marks the level within each HTF candle where the highest volume was recorded, using red for the most significant volume area.
Fully Customizable Display
Users can adjust the HTF timeframe, color settings, and resolution to tailor the indicator to their trading preferences.
Segmented Volume Distribution
Each HTF candle is divided into smaller levels, allowing traders to see volume changes within the range of each candle.
Key Level Detection
Max volume points often act as key support and resistance levels where price is likely to react, helping traders refine their strategies.
⯁ HOW TO USE
Identify Liquidity Zones
Use the max volume levels to determine areas where price is likely to find support or resistance.
Assess Trend Strength
Compare volume distribution between bullish and bearish HTF candles to gauge market momentum.
Optimize Trade Entries & Exits
Look for price reactions at high-volume areas to refine stop-loss and take-profit levels.
Adjust Heatmap Resolution
Customize the resolution setting to get a more detailed or broader view of volume segmentation within HTF candles.
⯁ CONCLUSION
The HTF Candle Volume Thermometer is a must-have tool for traders who want to integrate volume analysis with higher timeframe structures. By visualizing volume heatmaps within each HTF candle, this indicator helps traders pinpoint critical liquidity zones and key price levels.

Intrabar Volume Distribution [BigBeluga]Intrabar Volume Distribution is an advanced volume and order flow indicator that visualizes the buy and sell volume distribution within each candlestick.
🔔 Before Use:
Turn off the background color of your candles for clear visibility.
Overlay the indicator on the top layout to ensure accurate alignment with the price chart.
🔵 Key Features:
Inside Bar Volume Visualization:
Each candlestick is divided into two columns:
Left column displays the sell % volume amount.
Right column displays the buy % volume amount.
Provides a clear representation of buyer-seller activity within individual bars.
Percentage Volume Labels:
Labels above each bar show the percentage share of sell and buy volume relative to the total (100%).
Quickly assess market sentiment and volume imbalances.
Point of Control (POC) Levels:
Orange dashed lines mark the POC inside each bar, indicating the price level with the highest traded volume.
Helps identify key liquidity zones within individual candlesticks.
Multi-Timeframe Volume Analysis:
The indicator automatically uses a timeframe 20-30 times lower than the current one to gather detailed volume data.
For each higher timeframe candle, it collects 20-30 bars of lower timeframe data for precise volume mapping.
Each bar is divided into 100 volume bins to capture detailed volume distribution across the price range.
Bins are filled based on the aggregated volume from the lower timeframe data.
Lookback Period:
Allows traders to select how many bars to display with delta and volume information.
The beginning of the selected lookback period is marked with a gray line and label for quick reference.
Indicator displays up to 80 bars back
🔵 Usage:
Order Flow Analysis: Monitor buy/sell volume distribution to spot potential reversals or continuations.
Liquidity Identification: Use POC levels to locate areas of strong market interest and potential support/resistance.
Volume Imbalance Detection: Pay attention to percentage labels for quick recognition of buyer or seller dominance.
Scalping & Intraday Trading: Ideal for traders seeking real-time insight into order flow and volume behavior.
Historical Analysis: Adjust the lookback period to analyze past price action and volume activity.
Intrabar Volume Distribution is a powerful tool for traders aiming to gain deeper insight into market sentiment through detailed volume analysis, allowing for more informed trading decisions based on real-time order flow dynamics.

Swing Profile Analyzer [ChartPrime]Swing Profile Analyzer
The Swing Profile Analyzer is a comprehensive tool designed to provide traders with valuable insights into swing frequency profiles, enabling them to identify key price levels and areas of market interest.
⯁ KEY FEATURES
Swing Frequency Profiles
Automatically plots frequency profiles for each swing, highlighting price distribution and key levels of significance.
Point of Control (POC) Line
Marks the price level with the highest number of closes within a swing, acting as a key area for potential price reactions.
Customizable Trend Display
Allows users to toggle between displaying profiles for bullish swings, bearish swings, or both, offering tailored analysis.
Integrated ZigZag Lines
Visualizes swing highs and lows, providing a clear picture of market trends and reversals.
Dynamic Profile Visualization
Profiles are color-coded to indicate the frequency of closes, with the highest value bins distinctly marked for easy recognition.
Max Frequency Highlight
Displays numerical values for the most active price level within each profile, showing how many closes occurred at the peak bin.
Updates only after swing formed
Profiles and POC lines automatically appear after swing is done
⯁ HOW TO USE
Identify Critical Price Levels
Use the POC line and frequency distribution to locate levels where price is likely to react or consolidate.
Analyze Swing Characteristics
Observe swing profiles to understand the strength, duration, and behavior of market trends.
Plan Entries and Exits
Leverage significant price levels and high-frequency bins to make more informed trading decisions.
Focus on Specific Trends
Filter profiles to analyze bullish or bearish swings based on your trading strategy.
⯁ CONCLUSION
The Swing Profile Analyzer is an essential tool for traders seeking to understand price dynamics within market swings. By combining frequency profiles, POC levels, and trend visualization, it enhances your ability to interpret and act on market movements effectively.

Volume Footprint POC for Every CandleCalculating and plotting the Point of Control (POC) for every candle on a volume footprint chart can provide valuable insights for traders. Here are some interpretations and uses of this information:
1. Identify Key Price Levels
Highest Traded Volume: The POC represents the price level with the highest traded volume for each candle. This level often acts as a significant support or resistance level.
Confluence Zones: When multiple POCs align at similar price levels over several candles, it indicates strong support or resistance zones.
2. Gauge Market Sentiment
Buyer and Seller Activity: High volume at certain price levels can indicate where buyers and sellers are most active. A rising POC suggests stronger buying activity, while a falling POC suggests stronger selling activity.
Volume Profile: Analyzing the volume profile helps in understanding the distribution of traded volume across different price levels, providing insights into market sentiment and potential reversals.
3. Spot Trends and Reversals
Trend Continuation: Consistent upward or downward shifts in POC levels can indicate a trend continuation. Traders can use this information to stay in trending positions.
Reversal Signals: A sudden change in the POC direction may signal a potential reversal. This can be used to take profits or enter new positions.
4. Intraday Trading Strategies
Short-Term Trading: Intraday traders can use the POC to make informed decisions on entry and exit points. For example, buying near the POC during an uptrend or selling near the POC during a downtrend.
Scalping Opportunities: High-frequency traders can use shifts in the POC to scalp small profits from price movements around these key levels.
5. Volume-Based Indicators
Confirmation of Other Indicators: The POC can be used in conjunction with other technical indicators (e.g., moving averages, RSI) to confirm signals and improve trading accuracy.
Support and Resistance: Combining the POC with traditional support and resistance levels can provide a more comprehensive view of the market dynamics.
In summary, the Point of Control (POC) is a valuable tool for traders to understand market behavior, identify key levels, and make more informed trading decisions. If you have specific questions or need further details on how to use this information in your trading strategy, feel free to ask! 😊

Candles Volume HeatMap [BigBeluga]Candles Volume HeatMap
The Candle Volume HeatMap indicator is a unique and advanced tool that visualizes lower timeframe volume activity within higher timeframe candles, offering traders a granular perspective on volume distribution.
⚠️Important note: before using the indicator, it is necessary to apply it to the candles
🔵Key Features:
Volume HeatMap Visualization: The indicator breaks down each higher timeframe candle into 10 equal vertical segments (boxes) based on its high-to-low range. Each box represents a lower timeframe candle's volume activity, with more intense colors indicating stronger volume levels.
Lower Timeframe Integration: Automatically uses a timeframe 10x lower than the current chart. For example, on a 10-hour chart, it uses 1-hour candles to extract volume data.
POC (Point of Control): The highest volume box within each candle is marked with the volume value. The indicator also plots a horizontal POC line at the level of this box, highlighting significant areas of price interest. The POC line is removed once the price crosses it, ensuring the chart stays clean.
Delta Display (Optional): Traders can enable the Delta feature to analyze buyer vs. seller activity within each higher timeframe candle.
Delta is calculated by summing 10 lower timeframe candles: a bullish candle adds to buyers, while a bearish candle adds to sellers. Displays the net Delta percentage: positive values (white) indicate buyer dominance, while negative values (red) indicate seller dominance.
Dynamic Volume Scaling: The highest volume value in each candle is displayed inside its respective box, providing quick insights into critical price-volume levels.
🔵How It Works:
For each higher timeframe candle, the indicator analyzes 10 lower timeframe candles and maps their volume into 10 segments (boxes) between the high and low of the current candle.
The intensity of each box's color corresponds to the relative volume of the lower timeframe candle it represents.
The POC highlights the price level with the highest concentration of volume, aiding in identifying potential support/resistance zones.
Delta analysis offers additional insights into market sentiment by breaking down buyer and seller activity in each candle.
🔵Use Cases:
Spotting key volume areas within higher timeframe candles to identify support and resistance levels.
Analyzing volume concentration for potential breakout or reversal zones.
Leveraging Delta analysis to gauge market sentiment and confirm volume-based trends.
This indicator is ideal for traders seeking to combine volume analysis with price action, offering precise insights into volume distribution and market dynamics.

Real-Time HTF Volume Footprint [BigBeluga]Real-time HTF Volume Footprint Profile is designed to provide a comprehensive view of higher timeframe volume profiles on your current chart. It overlays critical volume information from larger timeframes (like daily, weekly, or monthly) onto lower timeframe charts, helping you spot significant levels where volume is concentrated, acting as potential support or resistance.
🔵 Key Features:
HTF High and Low Zones: The indicator highlights the high and low of the chosen higher timeframe with clear zones, marking them with boxes. These zones help you see the broader market structure at a glance.
Volume Profile within HTF Range: Each higher timeframe range displays a volume profile, showing the distribution of volume at each price level. The most-traded price is highlighted in blue, known as the Point of Control (POC), indicating the price level with the highest activity.
Dynamic POC Option: Activate Dynamic POC to observe how the Point of Control shifts over time, giving insight into changing market interests and potential price direction.
Timeframe Flexibility: Select from daily, weekly, and monthly ranges (and more) to overlay their footprint profiles on your lower timeframe chart. This helps you tailor the indicator to the trading horizon that suits your strategy.
Info Table: Table shows a traders which timeframe is selected with last high and low of the selected timeframe
Visual Clarity with Custom Colors: The indicator uses subtle fills and distinct colors to ensure volume profile data integrates seamlessly into your chart without overwhelming other indicators or price data.
🔵 When to Use:
The HTF Volume Footprint Profile is essential for traders who want to bridge the gap between high-timeframe and intraday analysis. By visualizing HTF volume distribution on lower timeframes, this tool helps you:
Spot potential liquidity zones where price might react.
Identify support and resistance levels within HTF ranges.
Monitor PoC shifts that indicate changes in market behavior.
Track how current price aligns with significant volume clusters, providing a clear edge for volume-based strategies.
This indicator empowers traders to analyze lower timeframes with the context of higher timeframe volume profiles, providing a solid basis for identifying critical support and resistance levels shaped by large volume clusters. Whether you’re looking to spot liquidity zones or align your trades with broader market trends, HTF Volume Footprint Profile equips you with a strategic view.

Range Detect SystemTechnical analysis indicator designed to identify potential significant price ranges and the distribution of volume within those ranges. The system helps traders calculate POC and show volume history. Also detecting breakouts or potential reversals. System identifies ranges with a high probability of price consolidation and helps screen out extreme price moves or ranges that do not meet certain volatility thresholds.
⭕️ Key Features
Range Detection — identifies price ranges where consolidation is occurring.
Volume Profile Calculation — indicator calculates the Point of Control (POC) based on volume distribution within the identified range, enhancing the analysis of market structure.
Volume History — shows where the largest volume was traded from the center of the range. If the volume is greater in the upper part of the range, the color will be green. If the volume is greater in the lower part, the color will be red.
Range Filtering — Includes multi-level filtering options to avoid ranges that are too volatile or outside normal ranges.
Visual Customization — Shows graphical indicators for potential bullish or bearish crossovers at the upper and lower range boundaries. Users can choose the style and color of the lines, making it easier to visualize ranges and important levels on the chart.
Alerts — system will notify you when a range has been created and also when the price leaves the range.
⭕️ How it works
Extremes (Pivot Points) are taken as a basis, after confirming the relevance of the extremes we take the upper and lower extremes and form a range. We check if it does not violate a number of rules and filters, perform volume calculations, and only then is the range displayed.
Pivot points is a built-in feature that shows an extremum if it has not been updated N bars to the left and N bars to the right. Therefore, there is a delay depending on the bars specified to check, which allows for a more accurate range. This approach allows not to make unnecessary recalculations, which completely eliminates the possibility of redrawing or range changes.
⭕️ Settings
Left Bars and Right Bars — Allows you to define the point that is the highest among the specified number of bars to the left and right of this point.
Range Logic — Select from which point to draw the range. Maximums only, Minimums only or both.
Use Wick — Option to consider the wick of the candles when identifying Range.
Breakout Confirmation — The number of bars required to confirm a breakout, after which the range will close.
Minimum Range Length — Sets the minimum number of candles needed for a range to be considered valid.
Row Size — Number of levels to calculate POC. *Larger values increase the script load.
% Range Filter — Dont Show Range is than more N% of Average Range.
Multi Filter — Allows use of Bollinger Bands, ATR, SMA, or Highest-Lowest range channels for filtering ranges based on volatility.
Range Hit — Shows graphical labels when price hits the upper or lower boundaries of the range, signaling potential reversal or breakout points.
Range Start — Show points where Range was created.

Linear Regression Channel UltimateKey Features and Benefits
Logarithmic scale option for improved analysis of long-term trends and volatile markets
Activity-based profiling using either touch count or volume data
Customizable channel width and number of profile fills
Adjustable number of most active levels displayed
Highly configurable visual settings for optimal chart readability
Why Logarithmic Scale Matters
The logarithmic scale option is a game-changer for analyzing assets with exponential growth or high volatility. Unlike linear scales, log scales represent percentage changes consistently across the price range. This allows for:
Better visualization of long-term trends
More accurate comparison of price movements across different price levels
Improved analysis of volatile assets or markets experiencing rapid growth
How It Works
The indicator calculates a linear regression line based on the specified period
Upper and lower channel lines are drawn at a customizable distance from the regression line
The space between the channel lines is divided into a user-defined number of levels
For each level, the indicator tracks either:
- The number of times price touches the level (touch count method)
- The total volume traded when price is at the level (volume method)
The most active levels are highlighted based on this activity data
Understanding Touch Count vs Volume
Touch count method: Useful for identifying key support/resistance levels based on price action alone
Volume method: Provides insight into levels where the most trading activity occurs, potentially indicating stronger support/resistance
Practical Applications
Trend identification and strength assessment
Support and resistance level discovery
Entry and exit point optimization
Volume profile analysis for improved market structure understanding
This Linear Regression Channel indicator combines powerful statistical analysis with flexible visualization options, making it an invaluable tool for traders and analysts across various timeframes and markets. Its unique features, especially the logarithmic scale and activity profiling, provide deeper insights into market behavior and potential turning points.

Volume Analysis - Heatmap and Volume ProfileHello All!
I have a new toy for you! Volume Analysis - Heatmap and Volume Profile . Honestly I started to work to develop Volume Heatmap then I decided to improve it and add more features such Volume profile, volume, difference in Buy/Sell volumes etc. I tried to put my abilities into this script and tried to use some new Pine Language™ features ( method, force_overlay, enum etc features ). I hope the usage of these new features would be an example for Pine Programmers.
Lets talk about how it works:
- It gets number of Rows/Columns from the user for each candle to create heatmap
- It calculates the number of the candles to analyze. Number of the candles may change by number of Rows/columns or if any volume / difference in volumes / volume profile is enabled
- It gets Closing/Opening price, Volume and Time info from lower time frame for each candle ( it can be up to 100K for each candle )
- After getting the data it calculates lower time frame to analyze
- Then it calculates how closing price moves, how much volume on each move and create boxes by the volume/move in each box
- The colors for each box calculated by volume info and closing price movements in the lower time frame
- It shows the boxes on Absolute places or Zero Line optionally
- it shows Volume, Cumulative volume, Difference between Buy/Sell volume for each column
- it changes empty box color by Chart background color, also you can change transparency
- At this time it creates Volume Profile with up to 25 rows
- As a new Pine Language™ feature, it can show Volume Profile in the indicator window or in Main chart, shows Value Area, Value Area High (VAH), Value Area Low (VAL), and draw it and POC (Point Of Control) in the indicator window and/or in the main chart
- Honestly the feature I like is that: For the markets that are not open 24/7, it combines the data from the lower time period without any gaps. For example, if you work for a market that is closed on Saturdays and Sundays, it ensures data integrity by omitting weekends and holidays. so for example if the data is like "ABC---DEF-X---YL-Z" then it makes this data like "ABCDEFXYLZ". In this way, there will be no data breaks in the displayed boxes, there will be no empty colons, and it will appear as if data is coming in at any time.
- Finally it shows Info Panel to give info, its background color automatically changes by the Chart background color
- Important! You should set your "Plan" accordingly, your plan is "Premium or Higher" or "Lower tier". so the script can understand the minimum time frame it can get data!!
I tried to share many screenshots below to explain it much better
How it looks?
it shows Highest Buy/Sell volumes brighter, move volume -> brighter
Volume Profile ( up to 25 row s) ( number of contained candles should be more than 1 )
Volume Profile can be shown in the main chart optionally
How the main chart looks:
Closing price shown and you can enable it, change colors & line width
Can include many candles according to Row&Column number you set
Optionally it can show cumulative volume for each candle
Closing prices from lower time frame
Shows Candle Body by changing background colors
It can shows all included candles on Zero line
You can change the colors of many things
You can set Empty box and border transparency
Table, Empty box Colors adjustment done automatically by chart background color
Sometimes we can not get data from some historical candles if time frame is high such 2days, 1 week etc, and it looks like:
It also checks if Chart time frame and Chart type is suitable
Enjoy!

Support Resistance UltimateThe "Support Resistance ULTIMATE" indicator is a comprehensive tool for traders on the TradingView platform, designed to identify key support and resistance levels using two primary techniques: pivot points and volume data. This indicator provides flexibility and customization, allowing traders to adapt it to their specific trading strategies.
KEY FEATURES
Pivot-Based Levels:
This feature calculates support and resistance levels using pivot points, which are derived from the high, low, and close prices of previous trading periods. Pivot points are crucial for forecasting potential market turning points.
Users can customize the pivot calculation by selecting the source type (either 'Close' or 'High/Low') and adjusting the lookback periods for both the left and right sides of the pivot calculation. This flexibility allows traders to adapt the indicator to different market conditions and timeframes.
Volume-Based Levels:
This option focuses on identifying support and resistance levels based on volume data, specifically the Point of Control (POC). The POC represents the price level with the highest traded volume during a specific time period, reflecting a consensus value among market participants.
The indicator includes a rolling POC calculation, allowing traders to dynamically assess areas of significant trading interest that may serve as support or resistance zones.
ADVANTAGES
Customization and Flexibility:
Traders can choose between pivot-based and volume-based levels or use both simultaneously, depending on their analysis needs. This dual approach provides a comprehensive view of market dynamics, accommodating various trading styles.
The indicator offers customizable color settings for support and resistance lines, enhancing chart readability and allowing traders to personalize their visual analysis.
Enhanced Market Insights:
By utilizing pivot points, traders can identify potential reversal or consolidation points, aiding in the prediction of market trends and the establishment of strategic entry and exit points.
Volume-based levels provide insights into market sentiment and participation, highlighting areas of strong support or resistance based on trading volume. This can improve risk management and trade execution by identifying high-probability trading zones.
Importance Scoring:
The indicator calculates the importance of each level based on the number of touches and the duration it holds. This scoring system helps traders assess the strength of support and resistance levels, with thicker lines indicating more significant levels.
This indicator is intended for educational and informational purposes only and should not be considered financial advice. Trading involves significant risk, and you should consult with a financial advisor before making any trading decisions. The performance of this indicator is not guaranteed, and past results do not predict future performance. Use at your own risk.

Delta Flow Profile [LuxAlgo]The Delta Flow Profile is a charting tool that tracks and visualizes money flow and the difference between buying and selling pressure accumulated within multiple price ranges over a specified period. It reveals the relationship between an asset's price and traders' willingness to buy or sell, helping traders identify significant price levels and analyze market activity.
The Normalized Profile displays the percentage of money flow at each price level relative to the maximum money flow level, enabling traders to easily compare levels and understand the relative importance of each price point in the context of overall trading activity.
🔶 USAGE
The Delta Flow Profile is made of two principal components with different usability, each one of them described in the sub-sections below.
🔹 Money Flow Profile
The Money Flow Profile illustrates the total buying and selling activity at different price ranges. By analyzing this profile, users can identify key price zones with substantial buying or selling pressure. These zones can often act as potential support or resistance.
The rows of the Money Flow Profile represent the trading activity at specific price ranges over a given period.
A normalized profile is included to compare each zone relative to the peak money flow using a percentage, with 100% indicating that a price range is the one with the highest accumulated money flow.
🔹 Delta Profile
The Delta Profile assesses the dominant sentiment (buying or selling) from volume delta at different price levels to gauge market sentiment and potential reversals.
Delta Profile rows with more significant buying or selling volume indicate dominance from one side of the market in that specific price area. Price coming back to that area might indicate willingness from a dominant side to further accumulate orders within it, potentially causing price to follow the direction established by this dominant side afterward.
The volume delta is determined from the user-selected Polarity Method, with "Bar Polarity" using candle sentiment to determine if a bar associated volume is buying or selling volume, and "Bar Buying/Selling Pressure" making use of the high/low price to obtain more precise results.
🔹 Level of Significance
Users can quickly highlight the price levels with the highest recorded money flow activity through the included "Level of Significance". Various display methods are included:
Developing: Show the price level with the highest recorded money flow activity spanning over the indicator calculation interval.
Level: Show the price level with the highest recorded money flow activity.
Row: Show the price zone with the highest recorded money flow activity.
These levels/zones can be used as potential support/resistance points and can serve as a reference of where prices might go next for market participants to accumulate orders.
🔶 SETTINGS
The script offers a range of customizable settings to tailor the analysis to your trading needs.
🔹 Calculation Settings
Money Flow Profile: Toggles the visibility of the Money Flow Profile.
Normalized: Toggles the visibility of the Normalized Profile.
Sentiment Profile: Toggles the visibility of the Sentiment Profile.
Polarity Method: Choose between Bar Polarity or Bar Buying/Selling Pressure to calculate the Sentiment Profile.
Level of Significance: Toggles the visibility of the level of significance line/zone.
Lookback Length / Fixed Range: Sets the lookback length.
Number of Rows: Specify how many rows each profile histogram will have.
🔹 Display Settings
Profile Width %: Alters the width of the rows in the histogram, relative to the profile length.
Profile Horizontal Offset: Enables moving the profile on the horizontal axis.
Profile Text: Toggles the visibility of profile texts, and alters the size of the text. Setting to Auto will keep the text within the box limits.
Currency: Extends the profile text with the traded currency.
Profile Price Levels: Toggles the visibility of the profile price levels.
🔶 RELATED SCRIPTS
Money-Flow-Profile
Volume-Profile-with-Node-Detection

Weighted Volume Profile | Flux Charts💎 GENERAL OVERVIEW
Introducing our new Weighted Volume Profile Indicator! This indicator renders a volume profile based on the volume of latest candlesticks. It can be adjusted to give more weight to recent or past candlesticks, or can be used as a normal volume profile. For more information, please read the full write-up.
Features of the new Weighted Volume Profile indicator :
Renders Volume Profile Of Current Ticker
Adjustable Weighthing Towards Past or Recent
Customizable Row Count & Maximum Distance
Left or Right Alignment
More Styling Options
🚩UNIQUENESS
This indicator differs from a normal volume profile indicator by it's ability to weight volumes based on their distance to the current time. Giving weight to volumes may offer new trading opportunities to traders as they can now see the most recent Point Of Control (POC) or a more powerful but past POC based on their choice. The indicator also has a variety of useful styling settings such as aligning the volume profile to the right or the left of the chart, POC Line styling and color settings for bullish & bearish volumes.
📌 HOW DOES IT WORK ?
A volume profile provides an in-depth look at trading activity over a period of time by plotting a histogram on the price axis. This indicator can also give weight to volumes based on their distance to the current time, essentially determining their importance for the profile. Here is how it works step-by-step :
1. Determine how much candlesticks the volume profile will cover (Analyze Bars setting)
2. Make a range from the highest point of chart to the lowest point of chart, then divide it into rows (Row Count setting)
3. For each candlestick, add it's volume to the corresponding row in the range. Note that the volume can be added into several rows if it overlaps with them.
4. If the candlestick is a bullish candlestick, we add it's volume into the bullish volume of the row, if it's a bearish candlestick, we add it to the bearish volume of the row.
With the weighted volume mode, which is activated if "Volume Weighthing" setting is set to "Recent" or "Past", all volumes get a penalty based on their distance to the latest candletstick. For example, if the setting is set to "Recent", the latest candlestick contributes it's volume by 100% to the corresponding row, but the candlestick which is 50 candlesticks far from the current candlestick only contributes it's volume by ~17% to the row. The same applies to the "Past" setting, but in the reversed order, where past candlesticks have more priority than the current ones.
Volume contribution percent for "Recent" setting : ((100 * 0.85) / (i + 1)) + (100 * (1.0 - 0.85))
Volume contribution percent for "Past" setting : ((100 * 0.85) * ((i + 1) / N)) + (100 * (1.0 - 0.85))
Where i = candlestick index from right to left, N = total number of candlesticks analyzed by the volume profile.
The Point Of Control (POC) line is drawn from the row with the most total volume, and is generally considered as a strong level because a lot of trading volume happened on that particular row. Traders may use this line as a support & resistance level.
Traders can use this indicator to have an insight of areas which price moves quickly without much volume, or see areas that holds the price still for much longer and plan their trades accordingly.
⚙️SETTINGS
1. General Configuration
Analyze Bars -> Total amount of bars that will be analyzed by the indicator from right to left.
Row Count -> The amount of rows that will the vertical range of chart will be divided into.
Volume Weighting -> The volume weighting mode as explained in the write-up.
2. Style
Align To -> The alignment of the volume profile.

Previous Day and Week RangesI've designed the "Previous Day and Week Ranges" indicator to enhance your trading strategy by clearly displaying daily and weekly price levels. This tool shows Open-Close and High-Low ranges for both daily and weekly timeframes directly on your trading chart.
Key Features :
Potential Support and Resistance: The indicator highlights previous day and week ranges that may serve as key support or resistance levels in subsequent trading sessions.
Customizable Display Options: Offers the flexibility to show or hide daily and weekly ranges based on your trading needs.
Color Customization: Adjust the color settings to differentiate between upward and downward movements, enhancing visual clarity and chart readability.
This indicator is ideal for traders aiming to understand market dynamics better, offering insights into potential pivot points and zones of price stability or volatility.

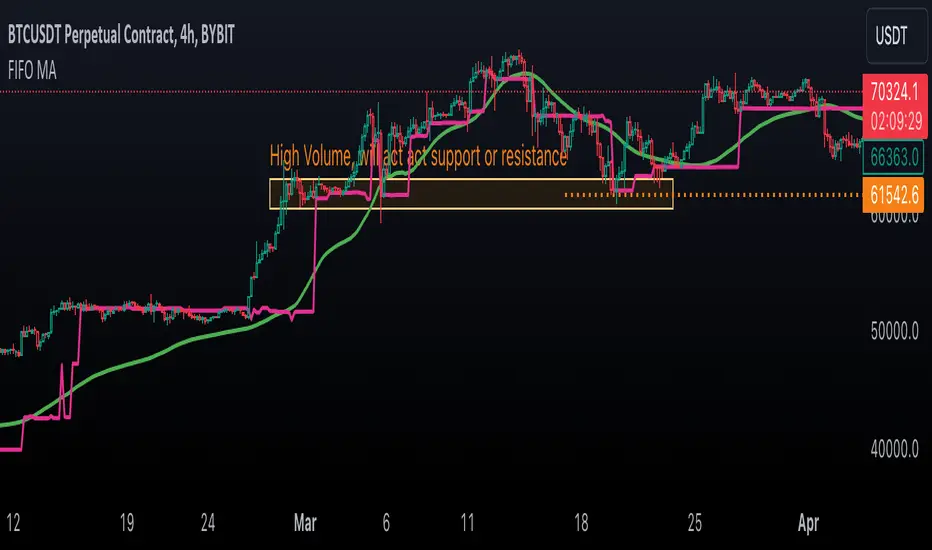
First In, First Out Moving AverageThis script is a tool designed to calculate a First In, First Out (FIFO) Moving Average (MA) using traded prices and volumes. Additionally, it computes the Point of Control (PoC) from, which identifies the price levels (developing POC) with the maximum volume. The script is built to provide traders with a comprehensive analysis of price movements and volume dynamics, enhancing their understanding of market trends and potential entry/exit points.
Understanding the Mechanics:
The script maintains arrays for prices and volumes, where hypothetical trades are added.
For long trades (identified by red candles/bars), traded prices and volumes are appended to the respective arrays.
Short trades (identified by green candles/bars) trigger the removal of volumes from the arrays following the FIFO principle.
This process ensures the adjustment of partial or complete removal of oldest entries based on traded volume.
Analyzing Profit and Loss (PnL):
The script also tracks a hypothetical Profit and Loss (PnL) to understand whether the outcome is in red (negative) or green (positive) - color of the FIFO MA.
Interpreting the Results:
Once the script is applied to the chart, traders can observe the FIFO Moving Average (MA) and Point of Control (PoC) lines plotted.
By analyzing these lines and the associated colors (indicating positive or negative PnL), traders can make informed decisions regarding market trends, support/resistance levels and potential trading opportunities.
Open Liquidity Heatmap [BigBeluga]Open Liquidity Heatmap is an indicator designed to display accumulated resting liquidity on the chart.
Unlike any other liquidity heatmap, this aims to accumulate liquidity at specific levels that build up over time, showing larger areas of liquidity.
🔶 FEATURES
The indicator includes the following settings:
Lookback : Used to determine the range calculation of the heatmap.
Leverage : Leverage of the liquidation (Counted as % in price, Example: 4.5 will return a distance from price of 4.5%, indicating any possible resting liquidity in this range).
Levels : Amount of levels to display (Each level is counted as liquidity resting on the chart; fewer levels will return a bigger area of liquidity sitting on the chart).
Mode : Apply a color gradient from the minimum liquidation to the maximum liquidity level. Set the maximum color gradient value (Counted as volume).
Offset : Automatically determine the offset range of the Volume Profiles. Manual offset of the Volume Profiles.
🔶 CALCULATION
for i = 0 to step - 1
float plotter = na
switch i
0 =>
plotter := hs
=>
plotter := hs - diff * ( i )
cls.hm.gnL(plotter)
cls.vp.put(plotter, 0)
We calculate levels like a normal volume profile with steps, from the highest point within the lookback to the lowest one. Each level will contain the corresponding amount of volume that the candle has closed in that range.
As we can see in the image above, we add liquidity each time the distance in % from price is between two levels.
Unlike many liquidity indicators that provide a single candle liquidity heatmap, this aims to add up liquidity (volume) in already present levels.
This can be extremely useful to see which levels are likely to be more liquid and tend to get a bigger reaction to the price.
Imagine it like a range of levels that each time price revisits that area, a new position area is added; we add volume in that area each time price visits that zone. Liquidity builds up in those zones, causing a bigger reaction to the price once the price visits it.
This indicator is not the same as a single candle heatmap like many others. What is a single candle heatmap?
A single candle heatmap is when a level is created on every new candle, coloring the level based on the total volume of it.
This indicator, on the contrary, aims to provide a more specific use by adding up liquidity each time price visits it.
🔶 BASIC DEMOSTRATION
This is a basic demonstration of how we can spot high liquidity points overall using confluence:
We see the POC of the liquidation in a low volume area of the normal volume profile adding up as confluence.
Resistance from the POC Volume Profile suggesting price will go lower.
Major long open liquidity down.
As we can see, price takes out all the long liquidity and right after pumping, indicating that all the major liquidity got taken out.
Some key note to take is that a POC in the liquidation heatmap in a low volume area of the normal Volume Profile add confluence of a possible big reaction in that zone.
In the forex market, we suggest to use a low distance from price (Leverage) while in a crypto market you can use the one that fit the best the current timeframe.
🔶 CONCLUSION
This indicator aims to show open resting liquidity that had built up over time, showing the most amount of liquidation in specific areas in an aggregated way unlike many liquidation heatmap indicators that show single-level liquidation.
🔶 RELATED SCRIPT

Volume Footprint Voids [BigBeluga]Volume Footprint Voids is a unique tool that uses lower timeframe calculation to plot different styles of single candle POC.
This indicator is very powerful for scalping and finding very precise entry and exits, spotting potential trapped traders, and more.
Unlike many other volume profiles, this aims to plot single candle profiles as well as their own footprints.
🔶 FEATURES
The script includes the following settings:
Windows: Plotting style and calculations
Coloring modes
Display modes
lower-timeframe calculations
🔶 CALCULATION
In the image above we can see how the script calculates each level position that will serve as a calculation process to see how much volume/closes there are within the levels.
In the image above, we can have a more clear example of how we count each candle close.
We use the prior screenshot as an example, after setting each level we will use the lower-timeframe input to measure the amount of closes within the ranges.
Depending on the lot size, the box will be larger or smaller, usually the POC will always have the highest box size.
NOTE: Size is the starting point, always from the low of the candle.
To find more voids, select a closer LTF to the current one you're using.
To find fewer voids, select a timeframe away from your current one.
Due to Pine Script limitations, we are only able to plot a certain amount of footprints, and we can't plot the whole history chart.
POC will be the largest block displayed, indicating the time point of control
Gray areas are closes above the average
Black are Void or imbalance that price will fill in the future, like FVG
The image above shows an incorrect size input that will lead to bad calculations, while on the other side, a correct size input that will lead to a clear vision and better calculation.
🔶 WINDOWS
The "▲▼" Mode will display delta buyers and delta sellers coloring with voids as black.
It also offers a gradient mode for a beautier visualization
The "Total Volume" mode will display the net volume within the lot size (closes within the levels).
This is useful to spot possible highest net volume within the same highest lot size.
The "POC + Gaps" will show both POC and Gaps as the highest block while all the rest will be considered as the smaller block.
This is useful to see where the highest lot were and if there are higher or lower imbalances within the candle
The last option "Gaps" will simply display the gaps as the highest block, while the POC as the lowest block.
This is useful to have a better view of the gaps areas
🔶 EXAMPLE
This is one of the most basic examples of how this script can be used. POC at the bottom creating a strong support area as price holds and creates higher voids gap that price fills while rising.
🔶 SETTINGS
Users have full control over the script, from colors to choosing the lower-timeframe inputs to disabling the lot size.

Volume Profile PlusThis indicator provides a high-resolution and high-precision implementation of Volume Profile with flexible range settings. Its key features include:
1. Support for a high resolution of up to 2,500 rows.
2. Capability to examine lower timeframe bars (default 5,000 intra-bars) for enhanced precision.
3. Three range modes — "Visible Range", "Anchored Range", and "All Range".
4. Highlighting of Point of Control and Value Area.
5. Extensive customization options allowing users to configure dimensions, on-chart placements, and color schemes.
🔵 Settings
The settings screen, along with the explanations for each setting, is provided below:
🔵 High Resolution using Polyline
Inspired by @fikira, this indicator utilizes the newly introduced `polyline` type in PineScript to plot the volume profile. It employs a single polyline instance to represent the entire histogram. With each polyline instance supporting up to 10,000 points and each histogram row requiring 4 points, this indicator can accommodate 2500 rows, resulting in a significantly higher resolution compared to conventional volume profile indicators that use `line`s or `box`es to draw the histogram.
🔵 High Precision Data-binning using Lower Timeframe Data
Conventional volume profile indicators often face one or both of the following limitations:
1. They only consider volume within the chart's current timeframe.
2. They assign each bar's total volume to a single price bucket based on the bar's average price, rather than distributing volume across multiple price buckets.
As a result, when the number of bars in the chart is low, those indicators may provide imprecise results, making it difficult to accurately identify significant volume nodes and the point of control.
To address these limitations and enhance accuracy, this indicator examines data from lower timeframes and distributes the volume to fine-grained price buckets. It intelligently selects an appropriate lower timeframe to ensure precise output while complying with a maximum specified number of bars to maintain good performance.
🔵 Three Range Modes
This indicator offers users the flexibility to choose from three range modes:
1. Visible Range (Default Mode): In this mode, the volume profile calculation begins at the time of the left-most bar displayed in the current viewport. As the user scrolls through the viewport, the volume profile updates automatically.
2. Anchored Range: This mode allows the user to set the start time either by using the datetime input boxes or by dragging the anchor line on the chart.
3. All Range: In this mode, the volume profile calculation is based on all the historical bars available in the chart.

PhantomFlow DynamicLevelsThe PhantomFlow Dynamic Levels indicator analyzes the dynamic volume over the period specified in the Period field. Channel boundaries can be used as dynamic support and resistance levels when trading within a range. The POC level also serves as a level at which the price may react during trend movements. The Period Multiplier parameter affects how many dynamic levels will be displayed. The Accuracy parameter influences the precision of volume calculations.
These levels are crucial for intraday traders as they serve as support or resistance. The Value Area zone includes 70% of the traded volume over the selected period. In other words, it represents the price region where the majority of traders believe the fair value for the asset lies.
The indicator's name, Dynamic Levels, aptly captures its essence. It analyzes trading volume at various price levels, tracking the sentiment dynamics of traders. When the asset's price decreases or increases as a result of trading, the Dynamic Levels indicator displays a new level on the chart. This results in a plotted line on the chart, allowing us to observe the movement dynamics of both the value area and the maximum volume level.
Standard indicators do not provide real-time visibility into level shifts, making the use of the Dynamic Levels indicator a competitive advantage in market trading across any time frame.
We borrowed the volume profile calculation code from @LonesomeTheBlue. Thank you for the work done!
