OPEN-SOURCE SCRIPT
FT-RSI
Summary of the Custom RSI Indicator Script (For Futu Niuniu Platform):
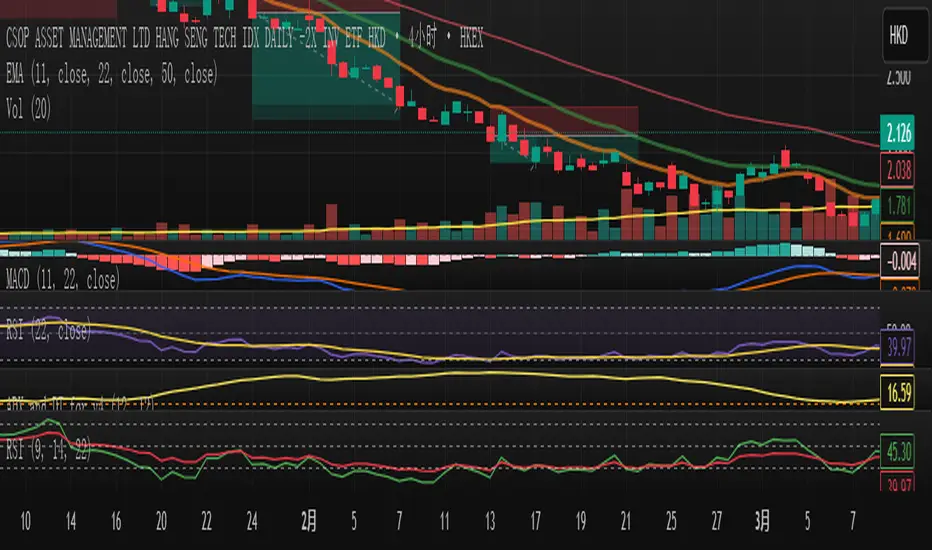
This Pine Script code implements a triple-period RSI indicator with horizontal reference lines (70, 50, 30) for technical analysis on the Futu Niuniu trading platform.
Key Features:
Multi-period RSI Calculation:
Computes three RSI values using 9, 14, and 22-period lengths to capture short-term, standard, and smoothed momentum signals.
Utilizes the Relative Moving Average (RMA) method for RSI calculation (ta.rma function).
Horizontal Reference Bands:
Upper Band (70): Red dotted line (semi-transparent) to identify overbought conditions.
Middle Band (50): Green dotted line as the neutral equilibrium level.
Lower Band (30): Blue dotted line (semi-transparent) to highlight oversold zones.
Visual Customization:
Distinct colors for each RSI line:
RSI (9): Orange (#F79A00)
RSI (14): Green (#49B50D)
RSI (22): Blue (#5188FF)
All lines have a thickness of 2 pixels for clear visibility.
Platform Compatibility:
This script is designed for Futu Niuniu’s charting system, leveraging Pine Script syntax adaptations supported by the platform. The horizontal bands and multi-period RSI logic help traders analyze trend strength and potential reversal points efficiently.
Note: Ensure Futu Niuniu’s scripting environment supports ta.rma and hline functions for proper execution.
Open-source script
In true TradingView spirit, the creator of this script has made it open-source, so that traders can review and verify its functionality. Kudos to the author! While you can use it for free, remember that republishing the code is subject to our House Rules.
Disclaimer
The information and publications are not meant to be, and do not constitute, financial, investment, trading, or other types of advice or recommendations supplied or endorsed by TradingView. Read more in the Terms of Use.