PROTECTED SOURCE SCRIPT
Updated vagab0nd Algo
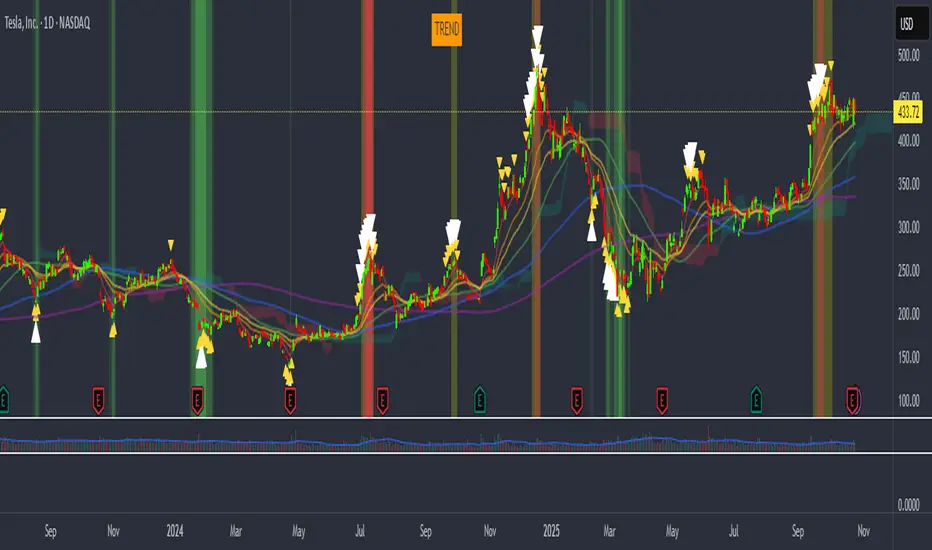
Combination of simple and exponential moving averages, SuperIchi cloud by LuxAlgo (love that group!), and a conglomeration of various indicators I've compiled over the years to try to spot tops and bottoms.
My custom indicator will highlight the background either green or orange/red and will show small yellow, or larger white arrows to indicate potential tops and bottoms. It is oscillator based so it can often show a strong signal for a top or bottom where price can rebound from, but will often retest or even stop loss run the previous signal area while not showing another signal. This indicates an underlying divergence that can potentially be taken advantage of.
My custom indicator will highlight the background either green or orange/red and will show small yellow, or larger white arrows to indicate potential tops and bottoms. It is oscillator based so it can often show a strong signal for a top or bottom where price can rebound from, but will often retest or even stop loss run the previous signal area while not showing another signal. This indicates an underlying divergence that can potentially be taken advantage of.
Release Notes
Updated chart to show this indicator only.Release Notes
Fixed a calculation issue.Protected script
This script is published as closed-source. However, you can use it freely and without any limitations – learn more here.
Disclaimer
The information and publications are not meant to be, and do not constitute, financial, investment, trading, or other types of advice or recommendations supplied or endorsed by TradingView. Read more in the Terms of Use.
Protected script
This script is published as closed-source. However, you can use it freely and without any limitations – learn more here.
Disclaimer
The information and publications are not meant to be, and do not constitute, financial, investment, trading, or other types of advice or recommendations supplied or endorsed by TradingView. Read more in the Terms of Use.