PROTECTED SOURCE SCRIPT
Daily SMA200 Distance - Percentile Zones
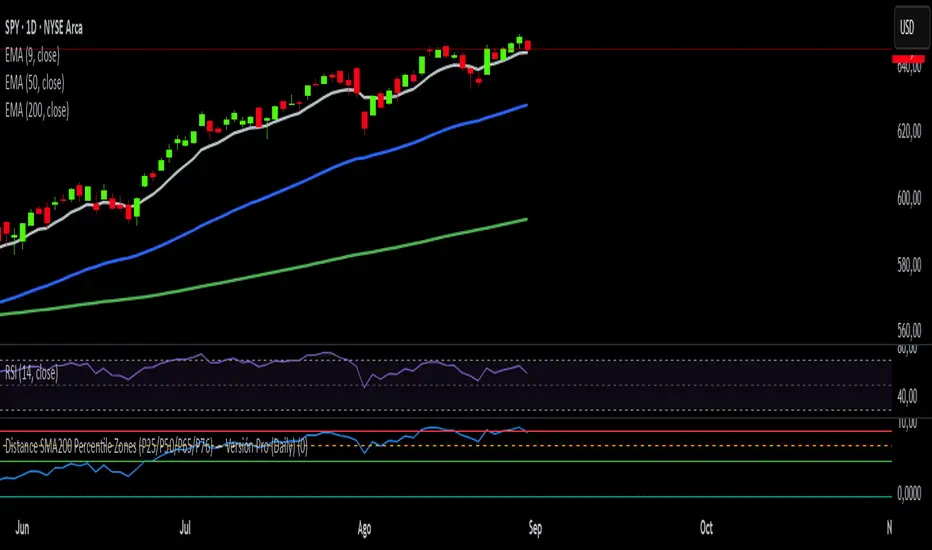
The Daily SMA200 Distance – Percentile Zones indicator measures the percentage distance of price relative to the 200-day Simple Moving Average (SMA200) and classifies it into historical percentile zones.
This tool helps identify the context of an asset in relation to its medium- to long-term trend:
Cheap Zone (< P25): price at historically low levels relative to the SMA200.
Value Zone (P25–P50): neutral range, where price trades around its medium-term average.
Acceptable Zone (P50–P65): moderately high levels, still reasonable within an uptrend.
Not Recommended Zone (P65–P76): overextended territory with rising correction risk.
Very Expensive Zone (≥ P76): extreme levels, historically linked to overvaluation and potential market tops.
Percentile calculations update dynamically with each new daily candle, providing a robust and objective statistical perspective for swing trading and portfolio management decisions.
Protected script
This script is published as closed-source. However, you can use it freely and without any limitations – learn more here.
Disclaimer
The information and publications are not meant to be, and do not constitute, financial, investment, trading, or other types of advice or recommendations supplied or endorsed by TradingView. Read more in the Terms of Use.