OPEN-SOURCE SCRIPT
Updated NAS100 - 5 Minute Opening Range with EMAs
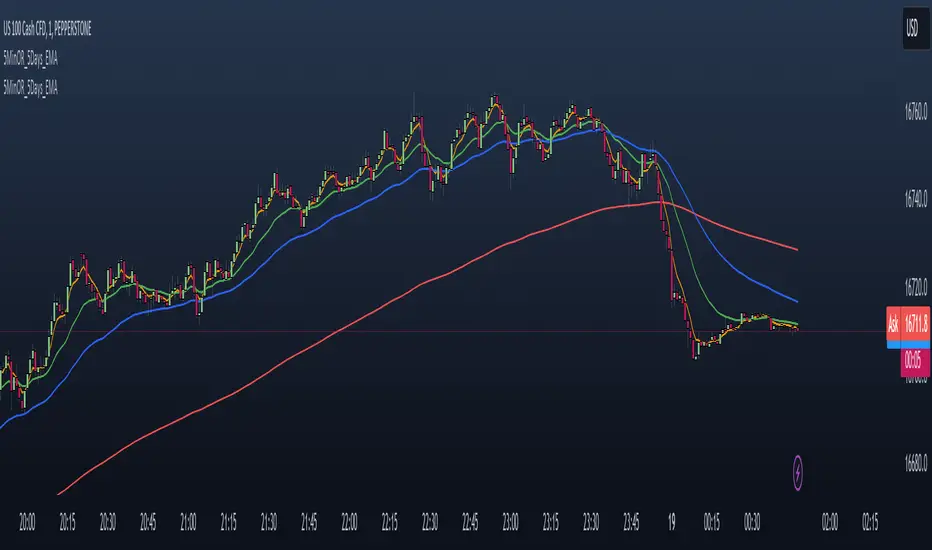
This indicator is designed for traders who focus on the opening range breakout strategy and use EMAs as part of their trading decisions. The script markes the first 5 min opening candle and generates Buy and Sell signals calculating EMA.
Basic features are :
User Inputs: Allows users to enable/disable alerts and choose to display Exponential Moving Averages (EMAs) for 5, 20, and 50 periods.
Opening Range Calculation: It calculates the first five minutes of the trading day, adjusting for different chart timeframes.
New Day Detection: Determines if the current bar is the first bar of a new day.
Data Storage: Utilizes arrays to store opening range highs, lows, start bars, and last bars for the last five days.
Daily Updates: Updates the stored data at the start of each new day, maintaining data for only the last five days.
Opening Range Plotting: Plots the opening ranges (high and low) for the past five days, with special plotting and filling for the current day.
EMA Calculation and Plotting: Calculates and plots EMAs (5, 20, and 50 periods) if enabled.
Alert Conditions: Sets up conditions for alerts when the price crosses above or below the current day's opening range.
Signal Generation: Generates buy and sell signals based on the relationship of the closing price to the opening range and the position of EMA5 relative to EMA50.
Signal Plotting: Plots buy and sell signals as triangles on the chart.
Release Notes
Added 200 EMAOpen-source script
In true TradingView spirit, the creator of this script has made it open-source, so that traders can review and verify its functionality. Kudos to the author! While you can use it for free, remember that republishing the code is subject to our House Rules.
Disclaimer
The information and publications are not meant to be, and do not constitute, financial, investment, trading, or other types of advice or recommendations supplied or endorsed by TradingView. Read more in the Terms of Use.
Open-source script
In true TradingView spirit, the creator of this script has made it open-source, so that traders can review and verify its functionality. Kudos to the author! While you can use it for free, remember that republishing the code is subject to our House Rules.
Disclaimer
The information and publications are not meant to be, and do not constitute, financial, investment, trading, or other types of advice or recommendations supplied or endorsed by TradingView. Read more in the Terms of Use.