PROTECTED SOURCE SCRIPT
Moving Average Difference [Vishal]
Moving Average Difference [Vishal]
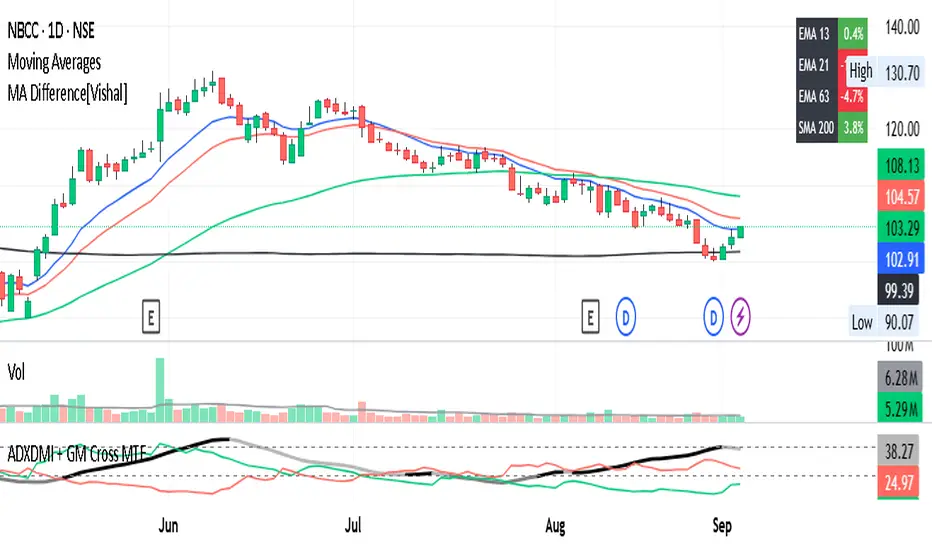
What it does: Displays four configurable moving-average gaps—each as the percentage difference between today’s price (current close) and a chosen MA—right on the main chart. The values appear in a compact table at the top-right of the canvas for quick, at-a-glance context.
How it’s calculated: For each row: (1 − MA / Price) × 100. Positive values mean the MA is below price; negative values mean the MA is above price.
Inputs (per row x4):
MA Type: EMA or SMA
Length: any positive integer
Display & formatting:
Small font; two columns: Label (e.g., “EMA 13”) and % Value (rounded to 0.0%).
Color-coded background for the value cell:
Red if < 0%
Green if 0%–9%
Black if > 9%
Uses the chart’s current timeframe and updates on the latest bar.
Notes:
Works as an overlay on the main chart.
Shows “na” if the value can’t be computed (e.g., insufficient bars or zero price).
Designed for a minimal footprint while keeping the readings always visible.
Protected script
This script is published as closed-source. However, you can use it freely and without any limitations – learn more here.
Disclaimer
The information and publications are not meant to be, and do not constitute, financial, investment, trading, or other types of advice or recommendations supplied or endorsed by TradingView. Read more in the Terms of Use.