OPEN-SOURCE SCRIPT
Inverse Moving Average Weighted (IWMA)
Description:
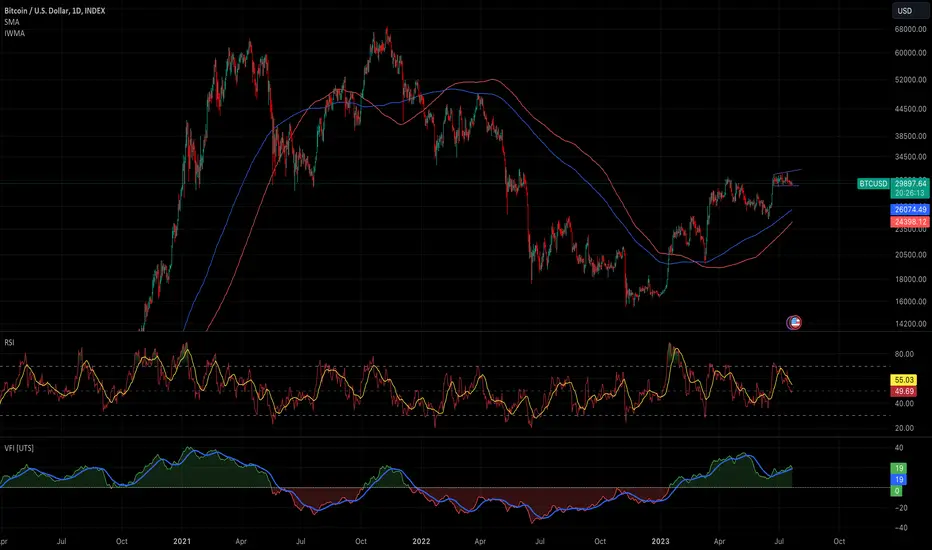
The Inverse Weighted Moving Average (IWMA) is a unique technical indicator that puts more emphasis on older price data compared to recent data. Unlike traditional moving averages that give more weight to recent data, the IWMA believes that older data points have a larger psychological impact on traders and therefore should be given more importance.
The IWMA is calculated by assigning weights to the price data points in a moving window, with the oldest data point given the highest weight and the most recent data point given the lowest weight. These weights are then used to calculate a weighted average, which forms the IWMA.
The IWMA can be used in the same way as other moving averages. When the price crosses above the IWMA, it may indicate a potential upward trend, signaling a good time to buy. Conversely, when the price crosses below the IWMA, it may indicate a potential downward trend, signaling a good time to sell.
The IWMA is a unique tool for traders who believe in the lasting impact of older price data. It provides a different perspective on price trends and can be a valuable addition to your trading toolkit.
Open-source script
In true TradingView spirit, the creator of this script has made it open-source, so that traders can review and verify its functionality. Kudos to the author! While you can use it for free, remember that republishing the code is subject to our House Rules.
Disclaimer
The information and publications are not meant to be, and do not constitute, financial, investment, trading, or other types of advice or recommendations supplied or endorsed by TradingView. Read more in the Terms of Use.