PROTECTED SOURCE SCRIPT
Trend vs Range Detector
Markets often oscillate between trend phases and range-bound consolidations. Accurately identifying which environment you're in can dramatically improve your strategy's performance — whether you're a breakout trader, trend follower, or mean reversion specialist.
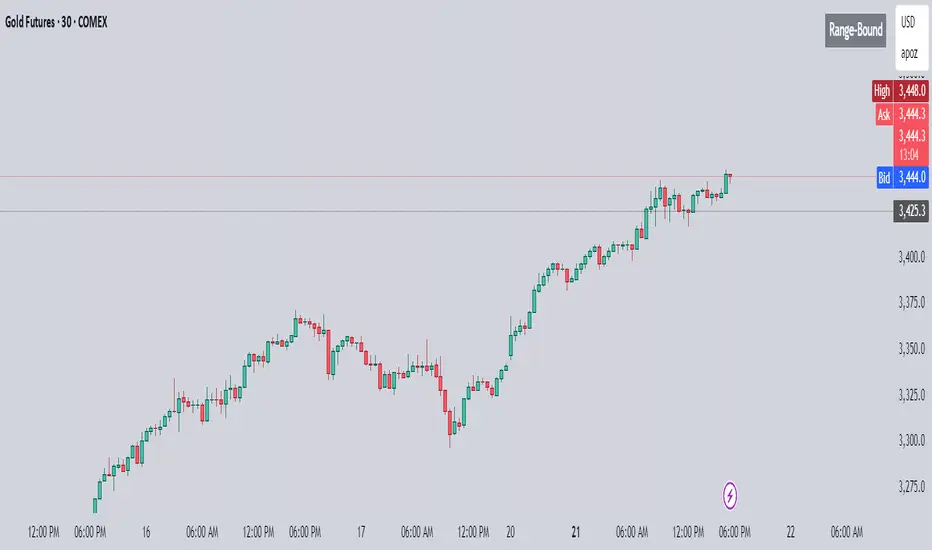
This Pine Script helps do exactly that — with zero clutter, no chart overlays, and a simple, clean table at the top-right corner telling you one thing:
👉 Is the market trending or range-bound?
⚙️ How It Works
The script uses two core metrics to classify the market environment:
1. Slope Sensitivity of Moving Average
A simple moving average (default: 50-period) is used.
The absolute slope of the moving average is calculated.
If the slope exceeds a user-defined sensitivity value, it indicates directional momentum.
2. ATR-to-Price Range Ratio
Measures volatility by comparing Average True Range (ATR) to the total high-low price range over the same period.
A higher ATR relative to the range indicates directional volatility — a trending behavior.
A low ratio signals a choppy or sideways market.
If both conditions are met, the table displays "Trending." If either condition fails, it shows "Range-Bound."
🧠 Why This Matters
Trend Traders: Know when to lean into momentum plays.
Mean Reversion Traders: Avoid whipsaw conditions or capitalize on sideways action.
Volatility Filters: Use this signal to apply different strategies to different market types.
🛠️ User Controls
Moving Average Length: Adjust trend sensitivity by length (default: 50)
Slope Sensitivity: Tune how steep a trend needs to be to qualify
ATR/Range Threshold: Calibrate what defines a volatile enough trend move
Toggle Table On/Off: Keep the chart clean if needed
🧼 Clean Visuals
No lines, no bands, no background colors.
Just a concise table in the top-right corner.
Perfect for scalpers, swing traders, or overlaying on busy strategies.
🔄 Real-Time + Historical
The script dynamically updates with every bar, so it works in real time and shows accurate historical context across any symbol or timeframe.
If you’re someone who wants a minimalist yet powerful insight into market context, this tool can be a game-changer.
Protected script
This script is published as closed-source. However, you can use it freely and without any limitations – learn more here.
Disclaimer
The information and publications are not meant to be, and do not constitute, financial, investment, trading, or other types of advice or recommendations supplied or endorsed by TradingView. Read more in the Terms of Use.