OPEN-SOURCE SCRIPT
Updated Fiyat - 55 EMA Uzaklık Sinyali
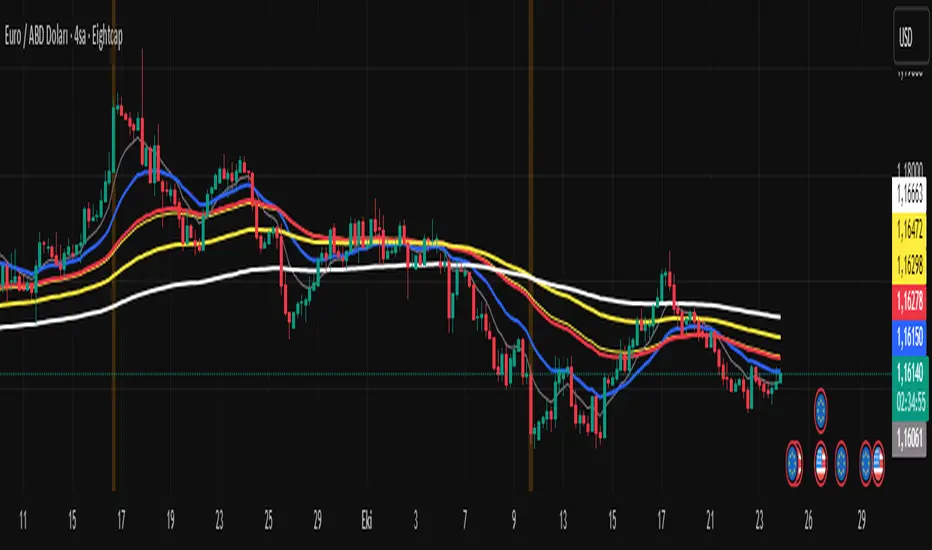
This indicator generates a signal when the price moves a certain percentage away from the 55-period Exponential Moving Average (EMA).
It helps traders identify when the market is stretched too far from its mean level, which can indicate potential reversal or continuation zones.
⚙️ How It Works
Calculates the 55 EMA on the selected chart.
Measures the percentage distance between the current price and the 55 EMA.
When the price distance exceeds the user-defined threshold (default: 0.50%), a visual signal (orange triangle) appears on the chart.
The background also highlights the signal candle.
🧩 Inputs
EMA Length: Default = 55 (can be changed).
Distance Threshold (%): Default = 0.50 → Change to detect stronger or weaker price deviations.
Release Notes
This script creates a unified trading signal based on the distance between the white and red lines (no yellow line involved).The white line represents the short-term slope of your moving average.
The red line is a slower moving average of that slope.
When the distance between these two lines becomes greater than a user-defined threshold, a green signal appears.
Both buy and sell signals are displayed in the same color (green) — the color only indicates that a significant distance has been reached, not the direction.
Open-source script
In true TradingView spirit, the creator of this script has made it open-source, so that traders can review and verify its functionality. Kudos to the author! While you can use it for free, remember that republishing the code is subject to our House Rules.
Disclaimer
The information and publications are not meant to be, and do not constitute, financial, investment, trading, or other types of advice or recommendations supplied or endorsed by TradingView. Read more in the Terms of Use.