OPEN-SOURCE SCRIPT
Moving Averages Histogram
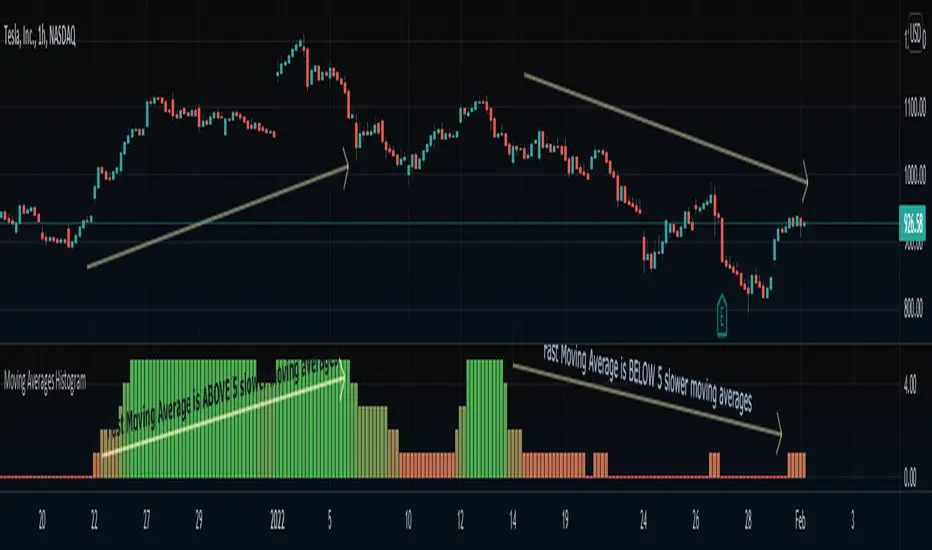
An interesting idea is to simplify the display of whether ONE fast-moving average crosses FIVE other slower-moving averages using just a histogram.
The idea is to increase the step counter by 1 every time a fast-moving average crosses OVER one of the five slower-moving averages until reaching 5 (highest value) and decrease the step counter by 1 every time the fast-moving average crosses UNDER each one of the five slower moving averages until reaching 0 (lowest value of the histogram).
=== Cut To Chase ===
If the histogram is at the top value 5 (green), it means the FAST moving average is ABOVE ALL slower-moving averages, Hench, the asset is up trending.
If the histogram is at the bottom value 0 (red), it means the FAST moving average is BELOW ALL slower-moving averages, Hench, the asset is down trending.
If the histogram is in the midways between 0 to 5, it means the FAST moving average is starting to cross the slower moving averages which could lead to a trend reversal, up or down, it depends on the direction of the crossing.
=== Notes ===
You can change from a variety of moving averages like RMA, EMA, ALMA, HMA, and so on.
You can reduce the number of slow-moving averages by placing the same length.
You can visualize the moving averages in case you want to see how it works behind, by going to settings and clicking 'Show MA lines'.
Every moving average length can be modified inside settings.
Note that the fast-moving average should have the lowest length.
You can visualize how the moving average is plotted:
Open-source script
In true TradingView spirit, the creator of this script has made it open-source, so that traders can review and verify its functionality. Kudos to the author! While you can use it for free, remember that republishing the code is subject to our House Rules.
Appreciation of my work: paypal.me/dman103
All Premium indicators: algo.win
LIVE Stream - Pivot Points Algo: youtube.com/channel/UCFyqab-i0xb2jf-c18ufH0A/live
All Premium indicators: algo.win
LIVE Stream - Pivot Points Algo: youtube.com/channel/UCFyqab-i0xb2jf-c18ufH0A/live
Disclaimer
The information and publications are not meant to be, and do not constitute, financial, investment, trading, or other types of advice or recommendations supplied or endorsed by TradingView. Read more in the Terms of Use.