OPEN-SOURCE SCRIPT
Ross Cameron-Inspired Day Trading Strategy
Explanation for Community Members:
Title: Ross Cameron-Inspired Day Trading Strategy
Description:
This script is designed to help you identify potential buy and sell opportunities during the trading day. It combines several popular trading strategies to provide clear signals.
Key Features:
Gap and Go: Identifies stocks that have gapped up or down at the open.
Momentum Trading: Uses RSI and EMA to identify momentum-based entry points.
Mean Reversion: Uses RSI and SMA to identify potential reversals.
How to Use:
Apply to Chart: Add this script to your TradingView chart.
Set Timeframe: Works best on 5-minute and 10-minute timeframes.
Watch for Signals: Look for green "BUY" labels for entry points and red "SELL" labels for exit points.
Parameters:
Gap Percentage: Adjust to identify larger or smaller gaps.
RSI Settings: Customize the RSI length and overbought/oversold levels.
EMA and SMA Lengths: Adjust the lengths of the moving averages.
Confirmation Period: Set how many bars to wait for confirmation.
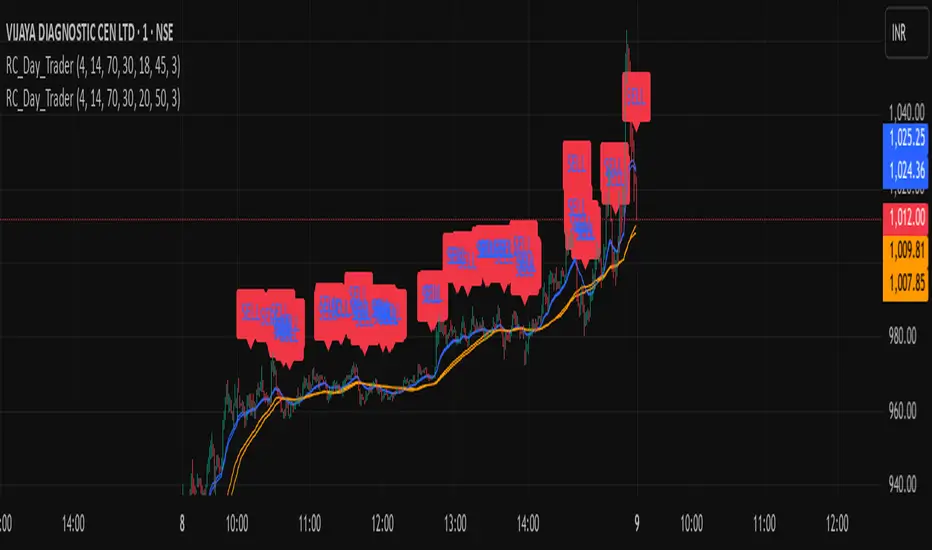
Visual Elements:
BUY Signals: Green labels below the price bars.
SELL Signals: Red labels above the price bars.
Indicators: Displays EMA (blue) and SMA (orange) for additional context.
This script is a powerful tool for day trading on NSE and BSE indices, combining multiple strategies to provide robust trading signals. Adjust the parameters to suit your trading style and always combine with your own analysis for best results.
Title: Ross Cameron-Inspired Day Trading Strategy
Description:
This script is designed to help you identify potential buy and sell opportunities during the trading day. It combines several popular trading strategies to provide clear signals.
Key Features:
Gap and Go: Identifies stocks that have gapped up or down at the open.
Momentum Trading: Uses RSI and EMA to identify momentum-based entry points.
Mean Reversion: Uses RSI and SMA to identify potential reversals.
How to Use:
Apply to Chart: Add this script to your TradingView chart.
Set Timeframe: Works best on 5-minute and 10-minute timeframes.
Watch for Signals: Look for green "BUY" labels for entry points and red "SELL" labels for exit points.
Parameters:
Gap Percentage: Adjust to identify larger or smaller gaps.
RSI Settings: Customize the RSI length and overbought/oversold levels.
EMA and SMA Lengths: Adjust the lengths of the moving averages.
Confirmation Period: Set how many bars to wait for confirmation.
Visual Elements:
BUY Signals: Green labels below the price bars.
SELL Signals: Red labels above the price bars.
Indicators: Displays EMA (blue) and SMA (orange) for additional context.
This script is a powerful tool for day trading on NSE and BSE indices, combining multiple strategies to provide robust trading signals. Adjust the parameters to suit your trading style and always combine with your own analysis for best results.
Open-source script
In true TradingView spirit, the creator of this script has made it open-source, so that traders can review and verify its functionality. Kudos to the author! While you can use it for free, remember that republishing the code is subject to our House Rules.
Disclaimer
The information and publications are not meant to be, and do not constitute, financial, investment, trading, or other types of advice or recommendations supplied or endorsed by TradingView. Read more in the Terms of Use.