MOM Buy/Sell + MACD Histogram Signal Table
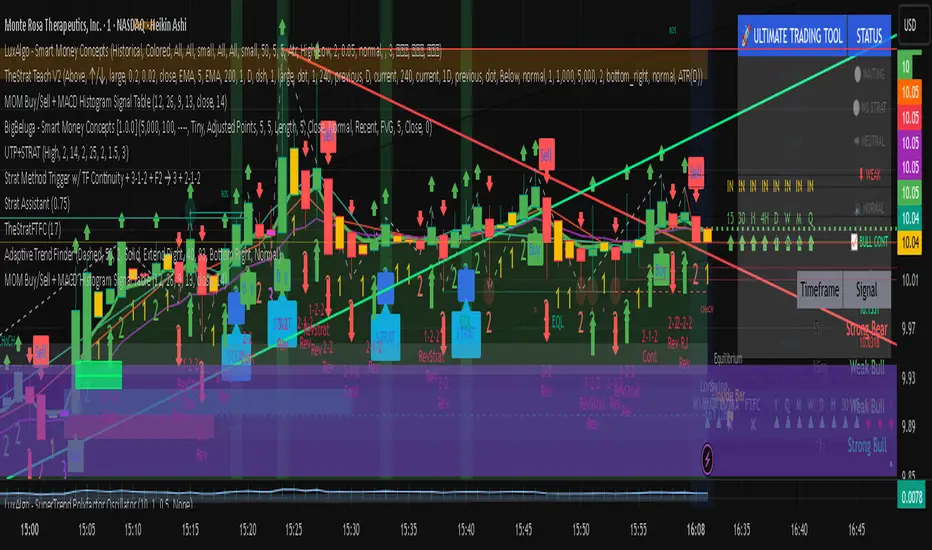
Combined Signal Analysis - Shows when both indicators align for STRONG BUY or STRONG SELL signals
Sortable Columns - Click any column header to sort by that metric
Filter Buttons - Quickly filter to see only Strong Buy, Strong Sell, or all signals
Color-Coded Values - Green for bullish, red for bearish, gray for neutral
Visual Icons - Trending arrows for easy signal recognition
Invite-only script
Only users approved by the author can access this script. You'll need to request and get permission to use it. This is typically granted after payment. For more details, follow the author's instructions below or contact jmslimus directly.
TradingView does NOT recommend paying for or using a script unless you fully trust its author and understand how it works. You may also find free, open-source alternatives in our community scripts.
Author's instructions
Disclaimer
Invite-only script
Only users approved by the author can access this script. You'll need to request and get permission to use it. This is typically granted after payment. For more details, follow the author's instructions below or contact jmslimus directly.
TradingView does NOT recommend paying for or using a script unless you fully trust its author and understand how it works. You may also find free, open-source alternatives in our community scripts.