OPEN-SOURCE SCRIPT
Institutional RSI Trendline Breakout Strategy
Key Features:
1. RSI Trendline Detection
Automatically identifies RSI resistance (bearish) and support (bullish) trendlines
Requires minimum touch points for validation
Dynamic trendline calculation with configurable pivot lookback
2. Market Structure Analysis
Detects swing highs/lows to identify uptrends and downtrends
Combines multiple trend confirmation methods (swing structure + moving averages)
Visual background highlighting for trend confirmation
3. Breakout Signals
Buy Signal: RSI breaks above resistance trendline + bullish market structure
Sell Signal: RSI breaks below support trendline + bearish market structure
Configurable breakout threshold to avoid false signals
4. ATR-Based Stop Loss
Dynamic stop loss placement based on market volatility
Multiplier-adjustable for different risk profiles
Visual plotting of stop loss levels
5. Signal Filters
Volume filter to confirm breakout validity
RSI level filters to avoid extreme conditions
Multiple validation layers for institutional-grade accuracy
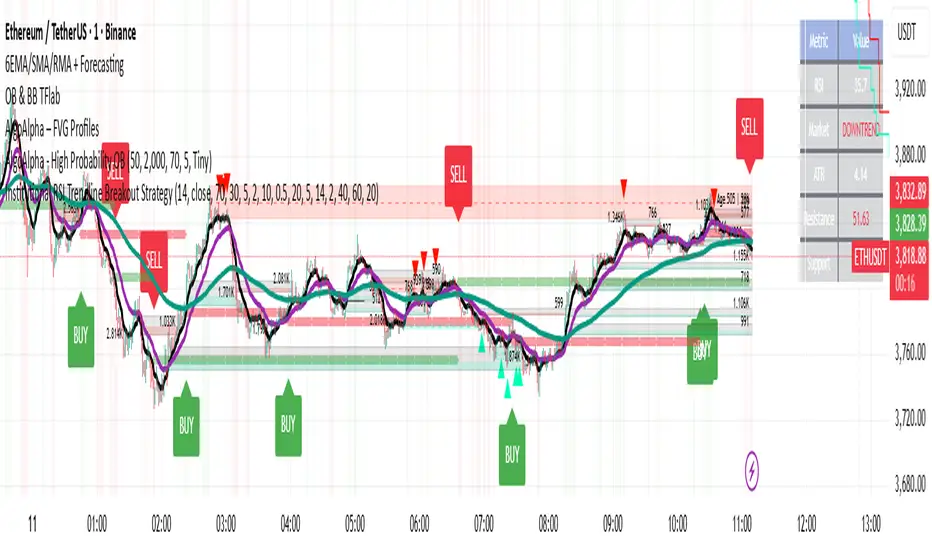
6. Professional Visualization
Clear buy/sell signal markers on chart
Information dashboard with real-time metrics
Trend background highlighting
Stop loss level indicators
7. Alert System
Ready-to-use alerts for both buy and sell signals
Includes entry price and stop loss in alert messages
This script provides institutional-grade signal quality with multiple confirmation layers, optimal risk management, and comprehensive market analysis.
1. RSI Trendline Detection
Automatically identifies RSI resistance (bearish) and support (bullish) trendlines
Requires minimum touch points for validation
Dynamic trendline calculation with configurable pivot lookback
2. Market Structure Analysis
Detects swing highs/lows to identify uptrends and downtrends
Combines multiple trend confirmation methods (swing structure + moving averages)
Visual background highlighting for trend confirmation
3. Breakout Signals
Buy Signal: RSI breaks above resistance trendline + bullish market structure
Sell Signal: RSI breaks below support trendline + bearish market structure
Configurable breakout threshold to avoid false signals
4. ATR-Based Stop Loss
Dynamic stop loss placement based on market volatility
Multiplier-adjustable for different risk profiles
Visual plotting of stop loss levels
5. Signal Filters
Volume filter to confirm breakout validity
RSI level filters to avoid extreme conditions
Multiple validation layers for institutional-grade accuracy
6. Professional Visualization
Clear buy/sell signal markers on chart
Information dashboard with real-time metrics
Trend background highlighting
Stop loss level indicators
7. Alert System
Ready-to-use alerts for both buy and sell signals
Includes entry price and stop loss in alert messages
This script provides institutional-grade signal quality with multiple confirmation layers, optimal risk management, and comprehensive market analysis.
Open-source script
In true TradingView spirit, the creator of this script has made it open-source, so that traders can review and verify its functionality. Kudos to the author! While you can use it for free, remember that republishing the code is subject to our House Rules.
Disclaimer
The information and publications are not meant to be, and do not constitute, financial, investment, trading, or other types of advice or recommendations supplied or endorsed by TradingView. Read more in the Terms of Use.