Trading Zone v2.0 [by TC]
Overview - Trading Zone v2.0 indicator
The Trading Zone indicator is powerful trading tool that works well both as a standalone signal generator and as a complementary confirmation for other technical indicators. Using a finely tuned algorithm based on multiple momentum strategies, the Trading Zone provides accurate entry and exit signals, while also helping traders identify overbought and oversold levels. This flexibility makes it ideal for any instrument, time frame, or trading style – whether you’re scalping, swing trading, or focusing on short-term trends.
📈 Trading Zone performs exceptionally in choppy markets, designed to help traders time their entries and exits with precision through a unique mix of momentum analysis and overbought/oversold detection.
Key Features
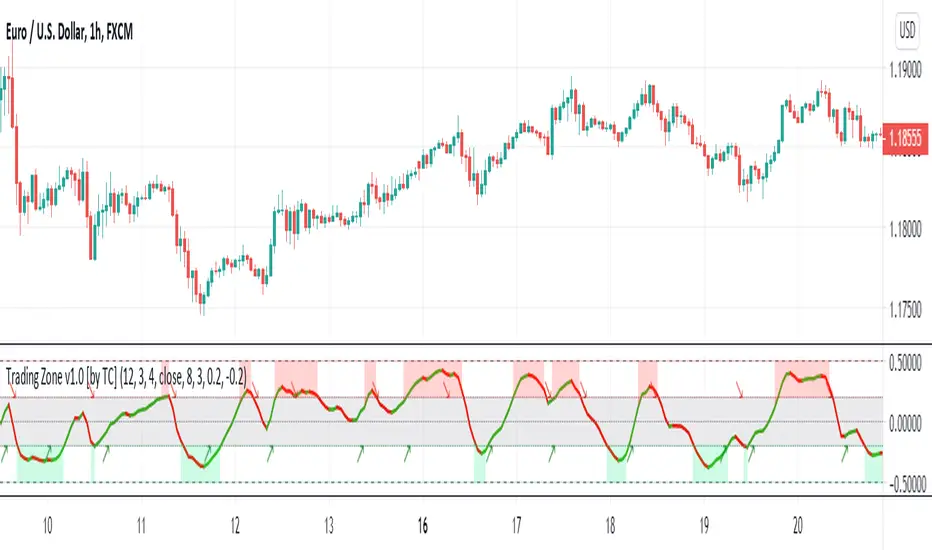
- Signal Line: A color-coded guide for identifying short-term trend direction (Green for positive trends, Red for negative trends), making it especially effective for timing optimal entries and exits.
- Filter Line: An optional filter line to visually smooth out noise and improve signal accuracy, providing better confirmation of trend direction.
- Overbought/Oversold Detection: Highlights extreme price levels using colored zones to signal potential trend reversals.
- Trade Arrows: Displays Buy and Sell arrows that indicate short-term momentum shifts, simplifying the identification of entry and exit points.
- Multi-Time Frame (MTF) Support: Offers MTF functionality to analyze trends across different resolutions.
Areas of Application
- Type of Indicator: Trading Zone is a momentum oscillator, combining momentum analysis with overbought/oversold detection. It’s suitable for scalping, swing trading, and short-term trend strategies.
- Markets: Works efficiently across all asset classes, including stocks, Forex, commodities, and cryptocurrencies. It performs particularly well in choppy or ranging market conditions.
- Time Frames: Fully compatible with all time frames, from 1-minute intraday charts to longer-term daily or weekly charts.
Settings & Customization
Although the default settings generally perform well across various instruments and time frames, it's highly recommended to experiment with and fine-tune these settings to enhance signal accuracy. Adjust the parameters according to your preferred noise tolerance level:
- 🔃 Period: This defines the length of the calculation period used by the indicator to assess the trend. A shorter period makes the indicator more sensitive to recent price movements, generating more frequent signals, while a longer period smooths out the signals, making them less responsive to minor price fluctuations. Adjust this setting based on your preferred balance between signal frequency and accuracy.
- 🔃 Signal Factor: The Signal Factor modifies the sensitivity of the indicator by influencing how strong a movement needs to be to generate a signal. A higher signal factor requires a larger price movement before a signal is triggered, making the indicator less reactive but more accurate. A lower signal factor generates more signals but may introduce more noise, making it suitable for scalping or very short-term trading.
- 🔃 Smoothing Length: This setting controls the degree of smoothing applied to the signal line. A higher smoothing length will reduce market noise and result in smoother signals, but it may also delay signals. A lower smoothing length will make the signals more reactive but might result in more false signals. Adjust this depending on how much noise you want to filter out.
- 🔃 Source: This defines the data source the indicator uses to calculate signals. You can select from various price points, such as the Close, Open, High, or Low. The choice of source affects how the indicator reacts to price changes.
- 🔃 Filter Line (thin line): When enabled, the thin line helps visually confirm trend direction by filtering out minor fluctuations. This is particularly useful in choppy markets where false signals are common.
- 🔃 Zone Thresholds: These values determine the boundaries for overbought and oversold conditions. Typically set at +0.2 and -0.2, these thresholds mark when the price has entered extreme levels. The price often remains in these zones during strong trends, and a breakout from these levels can signal trend reversals or significant shifts in market direction.
- 🔃 Trend Direction (RSI-period Trend and Multiplier Trend): These settings control how the upward and downward arrow signals are generated. The RSI-period Trend defines the length of the period used to measure relative strength, which helps in identifying potential trend changes. The Multiplier Trend amplifies the trend signals, making them more responsive or smoothed, depending on your settings. Together, these parameters determine how the indicator detects trend direction and when the arrows appear, allowing you to fine-tune the sensitivity of the algorithm to generate arrows for the trend direction.
- 🔃 Timeframe: This allows you to customize the time frame for Multi-Time Frame (MTF) analysis. By selecting a specific time frame, the indicator can assess momentum and trends based on that resolution, regardless of the current chart's time frame. This is particularly useful for confirming signals across different time frames (e.g., using a higher time frame to confirm a trend detected on a lower time frame).
Additional Features
- Overbought/Oversold Zones: These zones visually indicate when the price has reached an extreme. Although the price may remain in these zones for extended periods in trending markets, the breakout from the zones can signal strong trend reversal. A good entry point is often when the signal line breaks out of the oversold / overbought zones and crosses the sell (+0.2),- or buy (-0.2) zone line.
- Buy/Sell Alerts: Trade alerts for both signal line color changes and trend arrows provide actionable insights:
- "Buy - Signal Line Alert": Green signal line indicates a positive trend.
- "Sell - Signal Line Alert": Red signal line indicates a negative trend.
- "Buy - Up Trend Arrow": Green arrow suggests increased upward momentum.
- "Sell - Down Trend Arrow": Red arrow signals potential short opportunities.
⚠ Many traders underestimate the importance of aligning their indicator settings with their trading strategy. Each market, asset class, and instrument has its unique rhythm, range, and volatility, making it essential to invest time in adjusting and fine-tuning indicator settings to improve signal accuracy.
How to Use the Indicator:
1. Apply the Trading Zone indicator to any instrument and time frame, adjusting the settings as needed.
2. When the signal line turns positive (turns Green) or when the uptrend arrow is displayed (Green arrow, up) –> enter Long position.
3. When the signal line turns negative (turns Red) or when the downtrend arrow is displayed (Red arrow, down) –> exit Long position (or go Short).
4. Also exit the trade -> when it reaches your profit target, limit, or stop loss (determined by the user).
Pro Tip: Wait for the candlestick to close before acting on a signal to ensure the signal is confirmed and valid.
The way each trader uses the indicator varies. On shorter timeframes, it works well as a scalping tool by using the signal line as the main indicator. On higher timeframes, it serves as a reliable trend or timing indicator for regular trading and investment strategies. For very low or high timeframes, some fine-tuning of the settings may be necessary. The indicator is designed for use with traditional bar candles, though we also recommend pairing it with Heikin Ashi candles to filter out noise and better capture high-quality trends.
Tips for Best Results
- Adjust Settings for Different Time Frames: For shorter time frames (e.g., 1-minute, 5-minute), you may need to fine-tune the signal sensitivity to avoid false signals.
- Use with Alternative Candles: Consider using Heikin Ashi candles to filter out noise and gain a clearer picture of trends.
- Combine with Other Indicators: Enhance accuracy by using Trading Zone alongside support/resistance levels, volume indicators, or moving averages.
- Alert Settings: Set alerts using the “Once Per Bar Close” option to confirm signals on closed bars.
Important Notice
⚠ If you are new to trading and/or technical analysis, it´s recommended to start with a demo account (paper-trading) until you become familiar with how to use the indicator and before applying it to live trades.
The Trading Zone indicator is non-repainting, meaning signals do not change or disappear after the bar closes. While Trading Zone delivers reliable Buy/Sell signals, it is essential to combine it with a solid risk management strategy and other forms of technical analysis. Keep in mind that no indicator guarantees success, as markets are influenced by unpredictable events.
- Updated script for how to generate trade alerts for the Signal Line (signal color transition).
- Minor name change of the alert types.
- Introduced a (selectable) Filter Line to more effectively filter noise, improving the ability to confirm signals and trend direction.
- Optimized the logic for displaying the Signal Line color, enhancing trend direction clarity and reducing noise while maintaining accuracy.
- Added Multi-Time Frame (MTF) functionality with customizable resolution (default set to the chart's time frame).
- Revised variable names and titles in the Settings for better clarity and usability.
Invite-only script
Only users approved by the author can access this script. You'll need to request and get permission to use it. This is typically granted after payment. For more details, follow the author's instructions below or contact TradingCanyon directly.
Note that this private, invite-only script has not been reviewed by script moderators, and its compliance with House Rules is undetermined. TradingView does NOT recommend paying for or using a script unless you fully trust its author and understand how it works. You may also find free, open-source alternatives in our community scripts.
Author's instructions
Disclaimer
Invite-only script
Only users approved by the author can access this script. You'll need to request and get permission to use it. This is typically granted after payment. For more details, follow the author's instructions below or contact TradingCanyon directly.
Note that this private, invite-only script has not been reviewed by script moderators, and its compliance with House Rules is undetermined. TradingView does NOT recommend paying for or using a script unless you fully trust its author and understand how it works. You may also find free, open-source alternatives in our community scripts.