OPEN-SOURCE SCRIPT
Wilder's Channel
The Wilder’s channel is a typical channel indicator made of 2 Wilder’s average from the high and low price over a “p” period, factorized by the Average True Range value over “atx” period.
Indicator from Kevin Britain library.
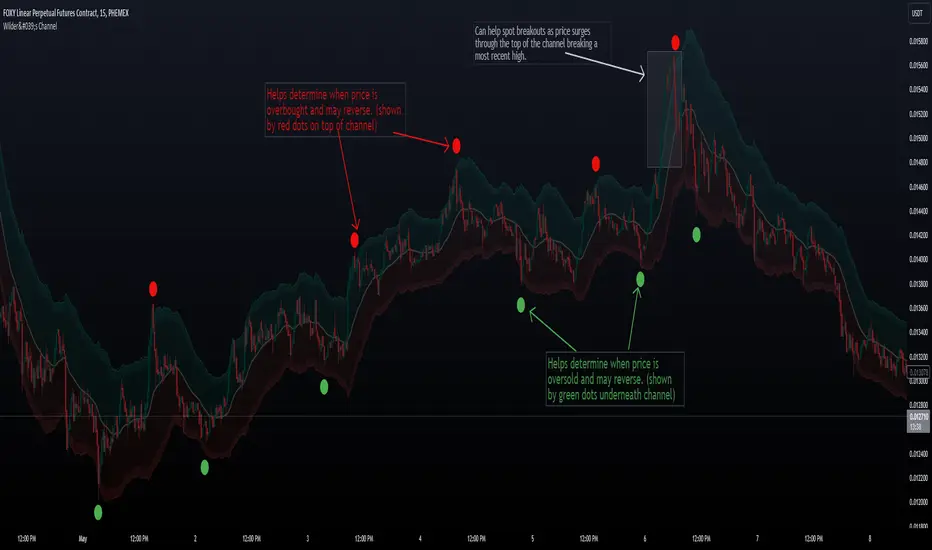
"Wilder's Channel," which is plotted on the chart overlay to assist traders in visualizing potential support and resistance levels. This script uses a combination of Wilder's Moving Average and the Average True Range (ATR) to create a channel around price movements. Here's a breakdown of how it works and its benefits:
Trend Confirmation: The channel helps confirm the current trend direction. If prices are consistently near the upper boundary, it suggests an uptrend, and vice versa for a downtrend.
Support and Resistance Levels: The Upper and Lower lines serve as dynamic support and resistance levels, which can help traders identify potential entry and exit points.
Volatility Insight: The width of the channel gives insight into market volatility. A wider channel indicates higher volatility, while a narrower channel suggests less volatility.
Trade Management: The buffer zones can be used for additional decision-making points, such as tightening stop-loss orders or preparing for potential breakouts or pullbacks.
Indicator from Kevin Britain library.
"Wilder's Channel," which is plotted on the chart overlay to assist traders in visualizing potential support and resistance levels. This script uses a combination of Wilder's Moving Average and the Average True Range (ATR) to create a channel around price movements. Here's a breakdown of how it works and its benefits:
Trend Confirmation: The channel helps confirm the current trend direction. If prices are consistently near the upper boundary, it suggests an uptrend, and vice versa for a downtrend.
Support and Resistance Levels: The Upper and Lower lines serve as dynamic support and resistance levels, which can help traders identify potential entry and exit points.
Volatility Insight: The width of the channel gives insight into market volatility. A wider channel indicates higher volatility, while a narrower channel suggests less volatility.
Trade Management: The buffer zones can be used for additional decision-making points, such as tightening stop-loss orders or preparing for potential breakouts or pullbacks.
Open-source script
In true TradingView spirit, the creator of this script has made it open-source, so that traders can review and verify its functionality. Kudos to the author! While you can use it for free, remember that republishing the code is subject to our House Rules.
Disclaimer
The information and publications are not meant to be, and do not constitute, financial, investment, trading, or other types of advice or recommendations supplied or endorsed by TradingView. Read more in the Terms of Use.