PROTECTED SOURCE SCRIPT
Updated Multi-Day OHLC Values – Analyze Up to 10 Days of Historical Mark
Overview
The Multi-Day OHLC Values indicator provides traders with a clean and customizable way to visualize critical historical price levels – including High, Low, Close, and VWAP – for up to 10 previous trading days. By highlighting these levels directly on the chart, the indicator helps traders identify key areas of support, resistance, and potential reversals based on past price action. This is particularly valuable for intraday and swing traders who rely on historical data to make informed decisions.
How It Works
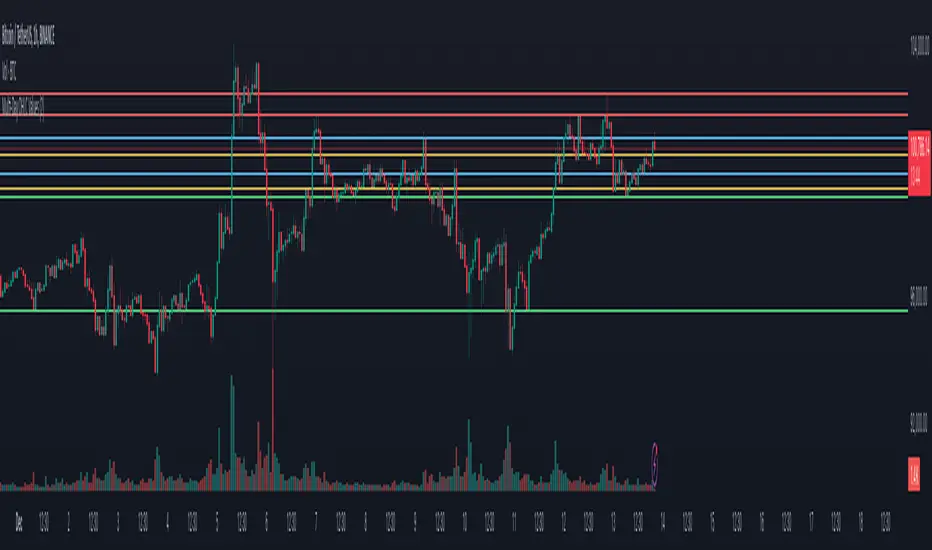
The script fetches daily high, low, close, and VWAP values for up to 10 previous trading sessions using Pine Script’s request.security() function. These levels are dynamically displayed on the chart as horizontal lines, color-coded for easy differentiation:
• Red for Highs: Identifies historical resistance levels.
• Green for Lows: Highlights historical support levels.
• Blue for Closes: Marks areas where price settled at the end of previous trading days.
• Yellow for VWAP: Tracks volume-weighted average prices, a critical benchmark for institutional and retail traders alike.
Each line is automatically updated daily, ensuring traders always have access to the latest historical data without manual adjustments. The user can control the number of days displayed (from 1 to 10), allowing for a tailored approach depending on their strategy.
Use Case
This indicator bridges the gap between past price data and actionable insights by offering a clear visualization of significant levels. Whether you’re a scalper, intraday trader, or swing trader, the Multi-Day OHLC Values indicator can be used to:
• Confirm breakout or reversal trades by aligning with historical price behavior.
• Identify zones of congestion or consolidation to avoid low-probability trades.
• Supplement support and resistance strategies by incorporating VWAP for institutional-grade analysis.
What Makes It Unique
This indicator focuses on simplicity and precision. Unlike other multi-indicator scripts that attempt to do too much, this tool hones in on the core elements of price action and market behavior: historical OHLC and VWAP levels. Its key features include:
• Customizability: Adjust the number of days to fit your trading style.
• Real-Time Updates: Automatically fetches and plots the most recent levels without any manual intervention.
• Clean Design: Avoids visual clutter by efficiently organizing lines and colors for readability.
By emphasizing accuracy and usability, the Multi-Day OHLC Values indicator ensures traders can rely on it to complement any technical trading strategy.
The Multi-Day OHLC Values indicator provides traders with a clean and customizable way to visualize critical historical price levels – including High, Low, Close, and VWAP – for up to 10 previous trading days. By highlighting these levels directly on the chart, the indicator helps traders identify key areas of support, resistance, and potential reversals based on past price action. This is particularly valuable for intraday and swing traders who rely on historical data to make informed decisions.
How It Works
The script fetches daily high, low, close, and VWAP values for up to 10 previous trading sessions using Pine Script’s request.security() function. These levels are dynamically displayed on the chart as horizontal lines, color-coded for easy differentiation:
• Red for Highs: Identifies historical resistance levels.
• Green for Lows: Highlights historical support levels.
• Blue for Closes: Marks areas where price settled at the end of previous trading days.
• Yellow for VWAP: Tracks volume-weighted average prices, a critical benchmark for institutional and retail traders alike.
Each line is automatically updated daily, ensuring traders always have access to the latest historical data without manual adjustments. The user can control the number of days displayed (from 1 to 10), allowing for a tailored approach depending on their strategy.
Use Case
This indicator bridges the gap between past price data and actionable insights by offering a clear visualization of significant levels. Whether you’re a scalper, intraday trader, or swing trader, the Multi-Day OHLC Values indicator can be used to:
• Confirm breakout or reversal trades by aligning with historical price behavior.
• Identify zones of congestion or consolidation to avoid low-probability trades.
• Supplement support and resistance strategies by incorporating VWAP for institutional-grade analysis.
What Makes It Unique
This indicator focuses on simplicity and precision. Unlike other multi-indicator scripts that attempt to do too much, this tool hones in on the core elements of price action and market behavior: historical OHLC and VWAP levels. Its key features include:
• Customizability: Adjust the number of days to fit your trading style.
• Real-Time Updates: Automatically fetches and plots the most recent levels without any manual intervention.
• Clean Design: Avoids visual clutter by efficiently organizing lines and colors for readability.
By emphasizing accuracy and usability, the Multi-Day OHLC Values indicator ensures traders can rely on it to complement any technical trading strategy.
Release Notes
added color code to change either color or to identify the color, which one is for which type.. like for open, high, close and vwap..Protected script
This script is published as closed-source. However, you can use it freely and without any limitations – learn more here.
Thanks.
TradeTech Analysis
Telegram Channel - t.me/Tradetech2024
Youtube Channel - youtube.com/@TradeTechAnalysis
Website - tradetechanalysis.com/
Super Profile - superprofile.bio/tradetechanalysis
TradeTech Analysis
Telegram Channel - t.me/Tradetech2024
Youtube Channel - youtube.com/@TradeTechAnalysis
Website - tradetechanalysis.com/
Super Profile - superprofile.bio/tradetechanalysis
Disclaimer
The information and publications are not meant to be, and do not constitute, financial, investment, trading, or other types of advice or recommendations supplied or endorsed by TradingView. Read more in the Terms of Use.
Protected script
This script is published as closed-source. However, you can use it freely and without any limitations – learn more here.
Thanks.
TradeTech Analysis
Telegram Channel - t.me/Tradetech2024
Youtube Channel - youtube.com/@TradeTechAnalysis
Website - tradetechanalysis.com/
Super Profile - superprofile.bio/tradetechanalysis
TradeTech Analysis
Telegram Channel - t.me/Tradetech2024
Youtube Channel - youtube.com/@TradeTechAnalysis
Website - tradetechanalysis.com/
Super Profile - superprofile.bio/tradetechanalysis
Disclaimer
The information and publications are not meant to be, and do not constitute, financial, investment, trading, or other types of advice or recommendations supplied or endorsed by TradingView. Read more in the Terms of Use.