OPEN-SOURCE SCRIPT
Normalized Market Indicators
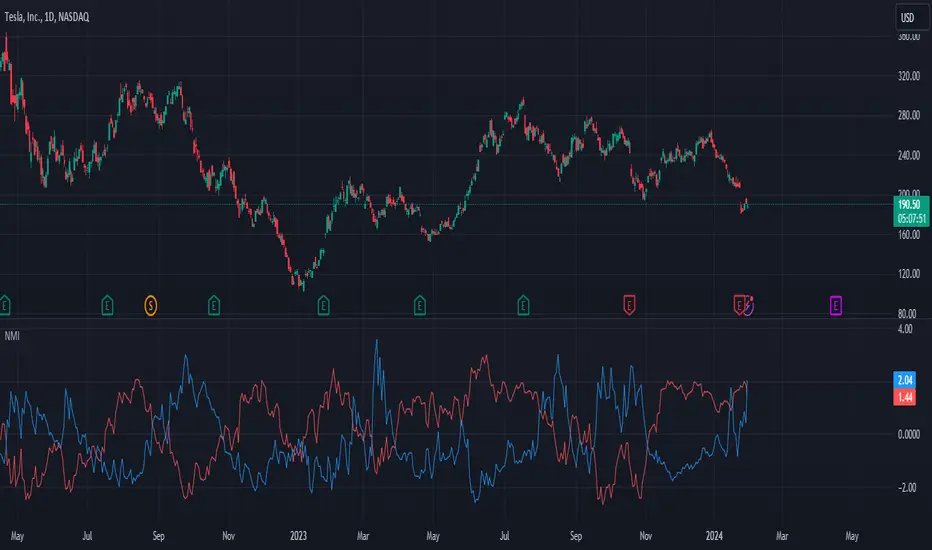
Explanation of the Code:
Data Retrieval: The script retrieves the closing prices of the S&P 500 (sp500) and VIX (vix).
Normalization: The script normalizes these values using a simple z-score normalization (subtracting the 50-period simple moving average and dividing by the 50-period standard deviation). This makes the scales of the two datasets more comparable.
Plotting with Secondary Axis: The normalized values of the S&P 500 and VIX are plotted on the same chart. They will share the same y-axis scale as the main chart (e.g. Netflix, GOLD, Forex).
Points to Note:
Normalization Method: The method of normalization (z-score in this case) is a choice and can be adjusted based on your needs. The idea is to bring the data to a comparable scale.
Timeframe and Symbol Codes: Ensure the timeframe and symbol codes are appropriate for your data source and trading strategy.
Overlaying on Price Chart: Since these values are normalized and plotted on a seperate chart, they won't directly correspond to the price levels of the main chart (e.g. Netflix, GOLD, Forex).
Open-source script
In true TradingView spirit, the creator of this script has made it open-source, so that traders can review and verify its functionality. Kudos to the author! While you can use it for free, remember that republishing the code is subject to our House Rules.
Disclaimer
The information and publications are not meant to be, and do not constitute, financial, investment, trading, or other types of advice or recommendations supplied or endorsed by TradingView. Read more in the Terms of Use.