PROTECTED SOURCE SCRIPT
Dual DEMA with Slope Coloring
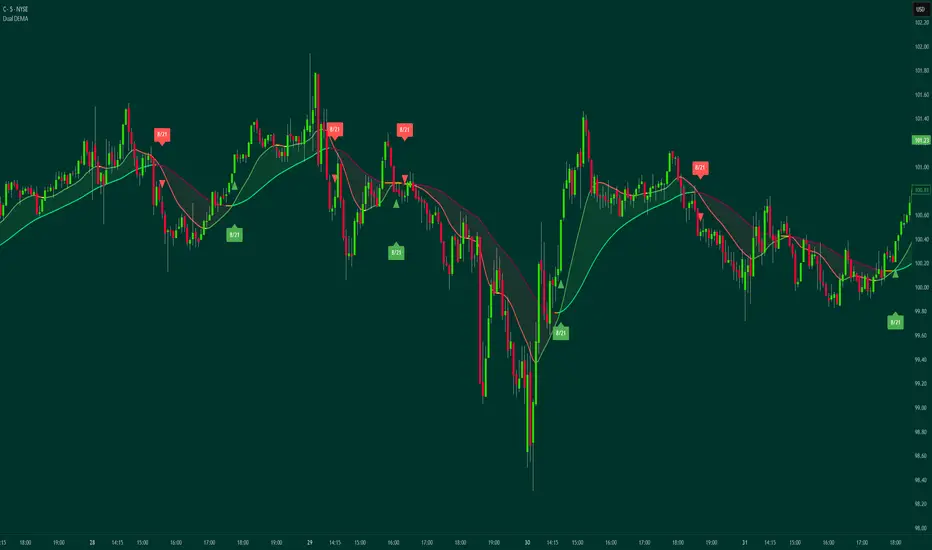
Dual DEMA with Slope Coloring & Signal Labels
Description
This indicator implements a dual moving average system using Double Exponential Moving Averages (DEMA) with an innovative slope-based color-coding mechanism and customizable crossover signal labels. The indicator addresses the common lag problem found in traditional moving averages by applying exponential smoothing twice, while adding a real-time momentum visualization layer through dynamic color changes based on each DEMA's rate of change.
Original Features & Methodology
What Makes This Script Unique:
Combines DEMA calculation with real-time slope analysis to create a visual momentum feedback system
Implements adjustable slope thresholds (measured in ticks per bar) that control color sensitivity independently for each DEMA
Features intelligent signal labels that display the exact period configuration (e.g., "8/21") with percentage-based vertical offset positioning to avoid chart clutter
How DEMA is Calculated:
The Double Exponential Moving Average reduces lag by applying exponential smoothing twice:
First EMA: EMA1 = EMA(Price, Length)
Second EMA: DEMA = EMA(EMA1, Length)
This double smoothing creates a faster-responding average compared to a single EMA while maintaining smoothness.
How Slope Coloring Works:
Each DEMA continuously calculates its slope using this formula:
Slope = (Current DEMA - Previous DEMA) / Tick Size
The slope is then compared against an adjustable threshold (default: 2.0, divided by 10 for scaling):
Green/Lime: Slope exceeds positive threshold (strong uptrend)
Red/Maroon: Slope exceeds negative threshold (strong downtrend)
Yellow/Orange: Slope within threshold range (consolidation/weak trend)
This provides instant visual feedback on momentum strength without requiring additional oscillators.
Signal Label System:
When the fast DEMA crosses the slow DEMA, a label appears showing the period configuration. Labels use percentage-based vertical offset calculated from the high/low of the signal bar, ensuring consistent positioning across different price scales and timeframes.
Key Features
🔹 Independent DEMA Configuration: Each DEMA has separate settings for source, length, displacement, and slope threshold
🔹 Real-Time Momentum Visualization: Color changes instantly reflect trend strength based on tick-normalized slope
🔹 Smart Crossover Labels: Auto-generated labels show periods with adjustable offset (percentage-based for consistency)
🔹 Displacement Option: Forward-shift DEMAs for predictive/leading analysis
🔹 Optional Fill Zone: Visual area between DEMAs shows relationship strength
🔹 Customizable Alerts: Built-in alert conditions for all crossover events
🔹 Multi-Asset Compatible: Slope calculation uses tick size for consistent behavior across instruments
Input Parameters Explained
DEMA 1 Settings (Fast Line)
Price Source: Which price data to use (close, open, high, low, hl2, hlc3, ohlc4)
Length: Number of periods for EMA calculation (default: 8 for responsive signals)
Displace: Shift DEMA forward by X bars (0 = no displacement)
Slope Threshold: Sensitivity control - lower values = more frequent color changes (default: 2.0)
DEMA 2 Settings (Slow Line)
Same parameters as DEMA 1, with default length of 21 for trend confirmation
Signal Controls
Show Crossover Signals: Display triangle markers at crossover points
Fill Between DEMAs: Shade area between lines (green when fast > slow, red when slow > fast)
Signal Label Options
Show Signal Labels: Toggle period labels on crossovers
Label Size: Visual size from Tiny to Huge
Vertical Offset: Distance from price bars as percentage (0.15% = ~15 ticks from bar on typical chart)
Color Settings: Independent colors for bullish and bearish signals
How to Use This Indicator
Setup:
Add indicator to chart - both DEMAs will display with default settings (8 and 21 periods)
Observe color changes - lines change from neutral (yellow/orange) to directional (green/red) as momentum builds
Adjust slope thresholds if colors change too frequently (increase) or too slowly (decrease)
Trading Signals:
Bullish Setup: Fast DEMA (8) crosses above slow DEMA (21) - look for long entries
Bearish Setup: Fast DEMA crosses below slow DEMA - look for short entries
Momentum Confirmation: Both DEMAs showing strong directional colors (green/lime or red/maroon)
Caution Zones: Neutral colors (yellow/orange) indicate weak momentum or consolidation
Recommended Configurations:
Scalping/Intraday: 5/15 or 8/21 periods with slope threshold 1.5-2.5
Swing Trading: 21/50 or 50/100 periods with slope threshold 1.0-2.0
Position Trading: 50/200 periods with slope threshold 0.5-1.5
Alert Setup:
Create alerts for crossover events to catch signals in real-time without constant chart monitoring.
Technical Details
Slope calculation normalizes using syminfo.mintick for consistent behavior across instruments
Label positioning uses percentage-based offset for price-scale independence
Works on all timeframes and asset classes (stocks, forex, crypto, futures, indices)
No repainting - all calculations use confirmed bar data
Best Practices
Use shorter periods for faster markets and longer timeframes
Combine with volume analysis or support/resistance for trade confirmation
Neutral colors often precede breakouts - wait for directional color confirmation
Adjust vertical offset if labels overlap with price action on busy charts
Consider higher slope thresholds in ranging markets to reduce false signals
This indicator serves as a comprehensive trend-following and momentum visualization tool, combining the lag-reduction benefits of DEMA with an intuitive color-coding system that provides at-a-glance market condition assessment.
Connect With Me
📧 Email: contact@savvytraderpro.com
📊 Website: savvytraderpro.com
🐦 X (Twitter): savvytraderpro
💬 Follow for more indicators, trading strategies, and market insights!
⚠️ Disclaimer:
This script is provided for educational and informational purposes only. It is not financial advice and should not be considered a recommendation to buy, sell, or hold any financial instrument. Trading involves significant risk of loss and is not suitable for every investor. Users should perform their own due diligence and consult with a licensed financial advisor before making any trading decisions. The author does not guarantee any profits or results from using this script, and assumes no liability for any losses incurred. Use this script at your own risk.
Protected script
This script is published as closed-source. However, you can use it freely and without any limitations – learn more here.
Disclaimer
The information and publications are not meant to be, and do not constitute, financial, investment, trading, or other types of advice or recommendations supplied or endorsed by TradingView. Read more in the Terms of Use.