OPEN-SOURCE SCRIPT
FDL Horizontal Levels + EMAs (US30 & YM1)
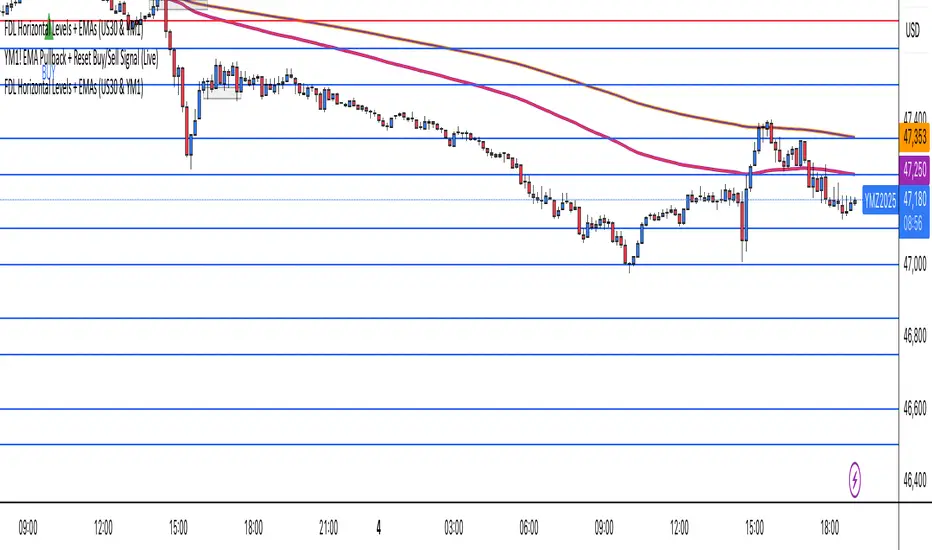
This indicator automatically plots institutional horizontal levels for US30 and YM1, so you don’t have to mark them manually. It also shows the 100 EMA and 200 EMA on all timeframes.
Horizontal levels are displayed on 3, 5, 10, 15, and 30-minute charts.
Horizontal levels are displayed on 3, 5, 10, 15, and 30-minute charts.
Open-source script
In true TradingView spirit, the creator of this script has made it open-source, so that traders can review and verify its functionality. Kudos to the author! While you can use it for free, remember that republishing the code is subject to our House Rules.
Disclaimer
The information and publications are not meant to be, and do not constitute, financial, investment, trading, or other types of advice or recommendations supplied or endorsed by TradingView. Read more in the Terms of Use.