OPEN-SOURCE SCRIPT
CM_DI_Plus_Minus
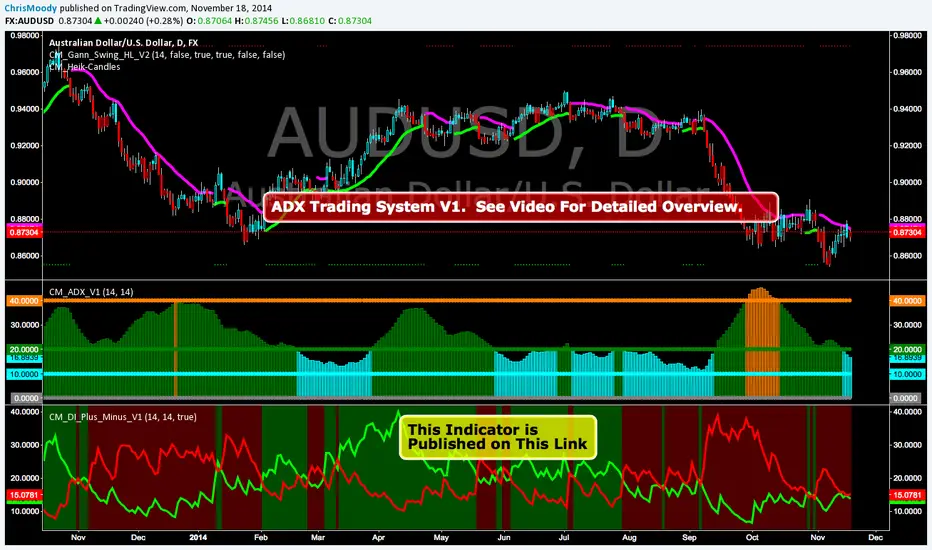
ADX System Overview
So I Came Across Another Trading System for Only $997. However, if you purchased in the next 24hours the whole system could be Yours For Only $497.
So I decided to Code it. This is only Version 1, and I discuss in the Video What I’ve found so for, some plans for Version 2 of the indicator, and I ask for your feedback on anything you find.
Indicators used in System:
CM_DI_Plus_Minus_V1 (Indicator On Bottom).
CM_ADX_V1 (Indicator On 2nd Pane).
CM_Gann_Swing_Hi_Lo (Indicator on Price Pane). This Indicator was published before…Link Below.
tradingview.com/v/ngO3BO37/
In Video I go over settings and how to customize charts.
Link To Video:
vimeopro.com/user32804960/tradingview-indicators/video/112194301
Link To Downloadable PDF Shown in Video:
d.pr/f/JX70
Open-source script
In true TradingView spirit, the creator of this script has made it open-source, so that traders can review and verify its functionality. Kudos to the author! While you can use it for free, remember that republishing the code is subject to our House Rules.
Coming Soon: ChrisMoodyTrading.com
Disclaimer
The information and publications are not meant to be, and do not constitute, financial, investment, trading, or other types of advice or recommendations supplied or endorsed by TradingView. Read more in the Terms of Use.