Break & Retest Strategy V2 (Clean Visuals)This strategy is built on a high-probability EMA breakout and retest model, designed for traders who want clean structure-based entries filtered by trend alignment and strong price action. It leverages:
• ✅ A 44 EMA trend filter on the 4H chart
• ✅ HTF directional bias from the Daily 44 EMA
• ✅ Breakout above the EMA followed by a wick-based retest
• ✅ Strong bullish candle confirmation (body > 50% of range)
• ✅ Dynamic stop loss using either the pivot low or a buffer below the EMA
• ✅ Fixed 1:3 Risk:Reward ratio for consistent reward targeting
• ✅ Cooldown system to prevent overtrading
• ✅ Clean, minimal visuals using smart RR boxes instead of chart clutter
This system is fully backtestable and designed with prop firm challenge criteria in mind — prioritizing risk control, clarity, and high-quality trade conditions.
⸻
🔧 Current Development Goals (V3 Roadmap)
We’re actively refining the system to improve win rate and profit factor, while keeping drawdown low. Key upgrades in progress:
1. 📈 Liquidity Trap Filter
• Add logic to confirm a wick below recent lows (liquidity sweep) before retesting the EMA
2. 🧠 Partial Take Profits + Breakeven Logic
• TP1 at 1.5R → move SL to breakeven
• TP2 at 3R → close remaining position
3. 🔁 Trade Session Filter
• Limit entries to London & New York AM sessions to avoid false signals in low volume periods
4. 📉 Short Entry Engine
• Mirror logic for bearish break + retest setups below the EMA
5. 🔔 Live Alerts System
• Entry signal alerts for hands-free, real-time trading decisions
6. 📊 Optimizer Toolkit (future)
• Add ATR/volatility filters
• Add market structure confluence zones (HH/HL filters)
• Smart cooldown timer based on wins/losses or volatility shifts
Pinescript

Volume Block Order AnalyzerCore Concept
The Volume Block Order Analyzer is a sophisticated Pine Script strategy designed to detect and analyze institutional money flow through large block trades. It identifies unusually high volume candles and evaluates their directional bias to provide clear visual signals of potential market movements.
How It Works: The Mathematical Model
1. Volume Anomaly Detection
The strategy first identifies "block trades" using a statistical approach:
```
avgVolume = ta.sma(volume, lookbackPeriod)
isHighVolume = volume > avgVolume * volumeThreshold
```
This means a candle must have volume exceeding the recent average by a user-defined multiplier (default 2.0x) to be considered a significant block trade.
2. Directional Impact Calculation
For each block trade identified, its price action determines direction:
- Bullish candle (close > open): Positive impact
- Bearish candle (close < open): Negative impact
The magnitude of impact is proportional to the volume size:
```
volumeWeight = volume / avgVolume // How many times larger than average
blockImpact = (isBullish ? 1.0 : -1.0) * (volumeWeight / 10)
```
This creates a normalized impact score typically ranging from -1.0 to 1.0, scaled by dividing by 10 to prevent excessive values.
3. Cumulative Impact with Time Decay
The key innovation is the cumulative impact calculation with decay:
```
cumulativeImpact := cumulativeImpact * impactDecay + blockImpact
```
This mathematical model has important properties:
- Recent block trades have stronger influence than older ones
- Impact gradually "fades" at rate determined by decay factor (default 0.95)
- Sustained directional pressure accumulates over time
- Opposing pressure gradually counteracts previous momentum
Trading Logic
Signal Generation
The strategy generates trading signals based on momentum shifts in institutional order flow:
1. Long Entry Signal: When cumulative impact crosses from negative to positive
```
if ta.crossover(cumulativeImpact, 0)
strategy.entry("Long", strategy.long)
```
*Logic: Institutional buying pressure has overcome selling pressure, indicating potential upward movement*
2. Short Entry Signal: When cumulative impact crosses from positive to negative
```
if ta.crossunder(cumulativeImpact, 0)
strategy.entry("Short", strategy.short)
```
*Logic: Institutional selling pressure has overcome buying pressure, indicating potential downward movement*
3. Exit Logic: Positions are closed when the cumulative impact moves against the position
```
if cumulativeImpact < 0
strategy.close("Long")
```
*Logic: The original signal is no longer valid as institutional flow has reversed*
Visual Interpretation System
The strategy employs multiple visualization techniques:
1. Color Gradient Bar System:
- Deep green: Strong buying pressure (impact > 0.5)
- Light green: Moderate buying pressure (0.1 < impact ≤ 0.5)
- Yellow-green: Mild buying pressure (0 < impact ≤ 0.1)
- Yellow: Neutral (impact = 0)
- Yellow-orange: Mild selling pressure (-0.1 < impact ≤ 0)
- Orange: Moderate selling pressure (-0.5 < impact ≤ -0.1)
- Red: Strong selling pressure (impact ≤ -0.5)
2. Dynamic Impact Line:
- Plots the cumulative impact as a line
- Line color shifts with impact value
- Line movement shows momentum and trend strength
3. Block Trade Labels:
- Marks significant block trades directly on the chart
- Shows direction and volume amount
- Helps identify key moments of institutional activity
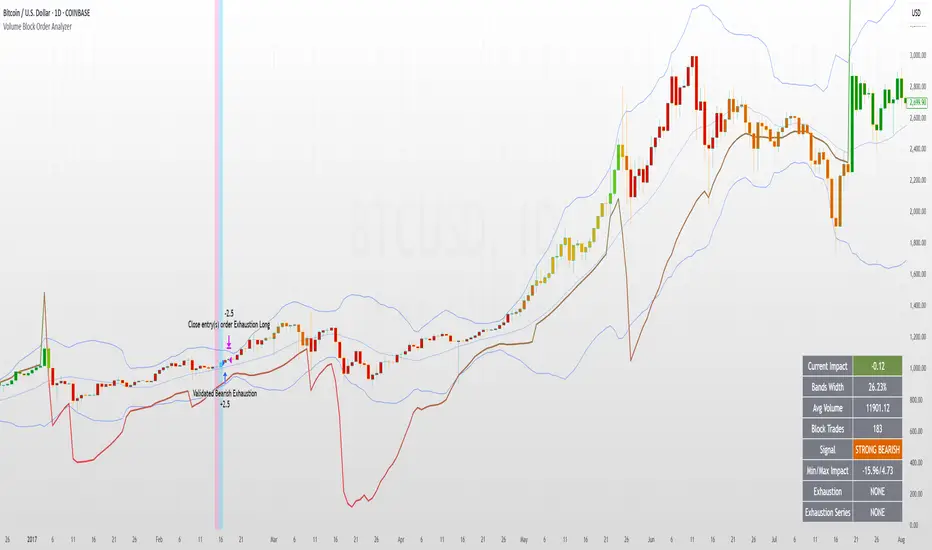
4. Information Dashboard:
- Current impact value and signal direction
- Average volume benchmark
- Count of significant block trades
- Min/Max impact range
Benefits and Use Cases
This strategy provides several advantages:
1. Institutional Flow Detection: Identifies where large players are positioning themselves
2. Early Trend Identification: Often detects institutional accumulation/distribution before major price movements
3. Market Context Enhancement: Provides deeper insight than simple price action alone
4. Objective Decision Framework: Quantifies what might otherwise be subjective observations
5. Adaptive to Market Conditions: Works across different timeframes and instruments by using relative volume rather than absolute thresholds
Customization Options
The strategy allows users to fine-tune its behavior:
- Volume Threshold: How unusual a volume spike must be to qualify
- Lookback Period: How far back to measure average volume
- Impact Decay Factor: How quickly older trades lose influence
- Visual Settings: Labels and line width customization
This sophisticated yet intuitive strategy provides traders with a window into institutional activity, helping identify potential trend changes before they become obvious in price action alone.
Cash And Carry Arbitrage BTC Compare Month 6 by SeoNo1Detailed Explanation of the BTC Cash and Carry Arbitrage Script
Script Title: BTC Cash And Carry Arbitrage Month 6 by SeoNo1
Short Title: BTC C&C ABT Month 6
Version: Pine Script v5
Overlay: True (The indicators are plotted directly on the price chart)
Purpose of the Script
This script is designed to help traders analyze and track arbitrage opportunities between the spot market and futures market for Bitcoin (BTC). Specifically, it calculates the spread and Annual Percentage Yield (APY) from a cash-and-carry arbitrage strategy until a specific expiry date (in this case, June 27, 2025).
The strategy helps identify profitable opportunities when the futures price of BTC is higher than the spot price. Traders can then buy BTC in the spot market and short BTC futures contracts to lock in a risk-free profit.
1. Input Settings
Spot Symbol: The real-time BTC spot price from Binance (BTCUSDT).
Futures Symbol: The BTC futures contract that expires in June 2025 (BTCUSDM2025).
Expiry Date: The expiration date of the futures contract, set to June 27, 2025.
These inputs allow users to adjust the symbols or expiry date according to their trading needs.
2. Price Data Retrieval
Spot Price: Fetches the latest closing price of BTC from the spot market.
Futures Price: Fetches the latest closing price of BTC futures.
Spread: The difference between the futures price and the spot price (futures_price - spot_price).
The spread indicates how much higher (or lower) the futures price is compared to the spot market.
3. Time to Maturity (TTM) and Annual Percentage Yield (APY) Calculation
Current Date: Gets the current timestamp.
Time to Maturity (TTM): The number of days left until the futures contract expires.
APY Calculation:
Formula:
APY = ( Spread / Spot Price ) x ( 365 / TTM Days ) x 100
This represents the annualized return from holding a cash-and-carry arbitrage position if the trader buys BTC at the spot price and sells BTC futures.
4. Display Information Table on the Chart
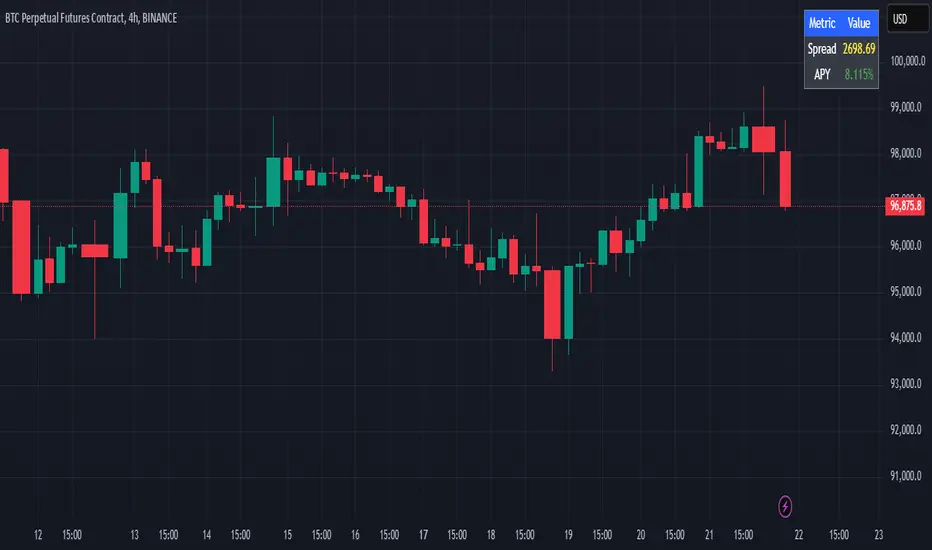
A table is created on the chart's top-right corner showing the following data:
Metric: Labels such as Spread and APY
Value: Displays the calculated spread and APY
The table automatically updates at the latest bar to display the most recent data.
5. Alert Condition
This sets an alert condition that triggers every time the script runs.
In practice, users can modify this alert to trigger based on specific conditions (e.g., APY exceeds a threshold).
6. Plotting the APY and Spread
APY Plot: Displays the annualized yield as a blue line on the chart.
Spread Plot: Visualizes the futures-spot spread as a red line.
This helps traders quickly identify arbitrage opportunities when the spread or APY reaches desirable levels.
How to Use the Script
Monitor Arbitrage Opportunities:
A positive spread indicates a potential cash-and-carry arbitrage opportunity.
The larger the APY, the more profitable the arbitrage opportunity could be.
Timing Trades:
Execute a buy on the BTC spot market and simultaneously sell BTC futures when the APY is attractive.
Close both positions upon futures contract expiry to realize profits.
Risk Management:
Ensure you have sufficient margin to hold both positions until expiry.
Monitor funding rates and volatility, which could affect returns.
Conclusion
This script is an essential tool for traders looking to exploit price discrepancies between the BTC spot market and futures market through a cash-and-carry arbitrage strategy. It provides real-time data on spreads, annualized returns (APY), and visual alerts, helping traders make informed decisions and maximize their profit potential.
Lines and Table for risk managementABOUT THIS INDICATOR
This is a simple indicator that can help you manage the risk when you are trading, and especially if you are leverage trading. The indicator can also be used to help visualize and to find trades within a suitable or predefined trading range.
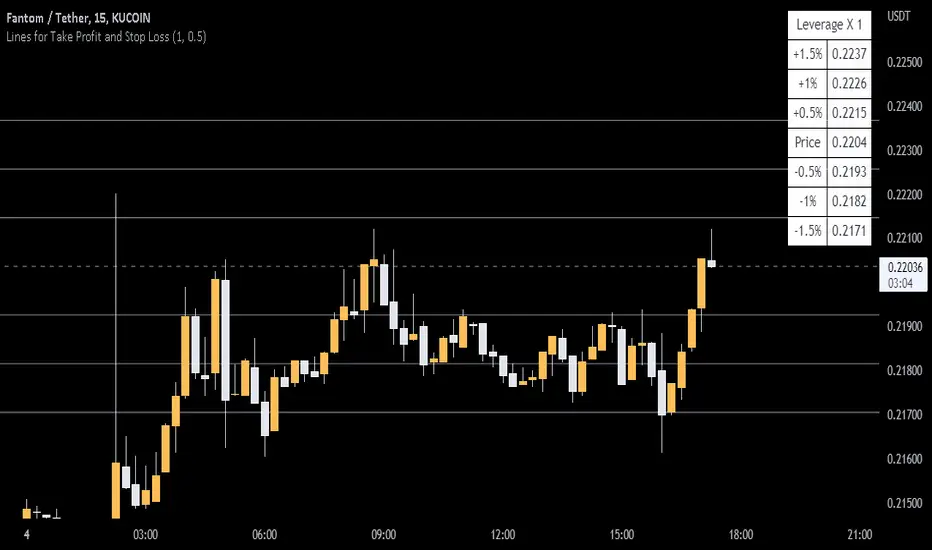
This script calculates and draws six “profit and risk lines” (levels) that show the change in percentage from the current price. The values are also shown in a table, to help you get a quick overview of risk before you trade.
ABOUT THE LINES/VALUES
This indicator draws seven percentage-lines, where the dotted line in the middle represents the current price. The other three lines on top of and below the middle line shows the different levels of change in percentage from current price (dotted line). The values are also shown in a table.
DEFAULT VALUES AND SETTINGS
By default the indicator draw lines 0.5%, 1.0%, and 1.5% from current price (step size = 0.5).
The default setting for leverage in this indicator = 1 (i.e. no leverage).
The line closest to dotted line (current price) is calculated by step size (%) * leverage (x) = % from price.
Pay attention to the %-values in the table, they represent the distance from the current price (dotted line) to where the lines are drawn.
* Be aware! If you change the leverage, the distance from the closest lines to the dotted line showing the current price increase.
SETTINGS
1. Leverage: set the leverage for what you are planning to trade on (1 = no leverage, 2 = 2 x leverage, 5 = 5 x leverage...).
2. Stepsize is used to set the distance between the lines and price.
EXAMPLES WITH DIFFERENT SETTINGS
1) Leverage = 1 (no leverage, default setting) and step size 0.5 (%). Lines plotted at (0.5%, 1%, 1.5%, and –0.5%, –1%, –1,5%) from the current price.
2) Leverage = 3 and stepsize 0.5(%). Lines plotted at (1.5%, 3.0%, 4.5%, and –1.5%, –3.0%, –4.5%) from the current price.
3) Leverage = 3 and stepsize 1(%). Lines plotted at (3%, 6%, 9%, and –3%, –6%, –9%) from the current price.
The distance to the nearest line from the current price is always calculated by the formula: Leverage * step size (%) = % to the nearest line from the current price.
Pine Script Boilerplate ExampleI frequently receive questions about my coding style and logic, so I decided to publish a simple indicator that draws the OHLC of a higher timeframe as an example of my coding style. This example will also explain my approach to writing indicators.
This indicator showcases how I use Types and Methods to structure my code and maintain clarity in logic. It demonstrates how I collect input data, organize the flow of the code, and utilize the TradingView method feature.
The example illustrates:
1. The use of input settings within a settings object to keep configurations grouped together.
2. The use of Types to create an object that consolidates relevant data.
3. The collection of objects to create, update, and render elements on the chart.

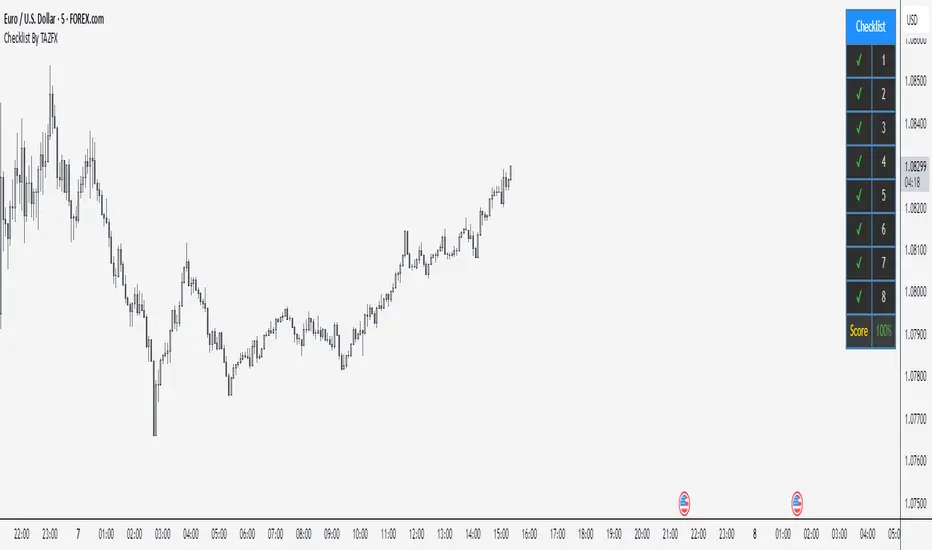
Checklist By TAZFX with Trade ScoreTrading Checklist is a customizable indicator designed for traders who want to stay disciplined and stick to their trading rules. Using this indicator, you can easily create and display your own personalized checklist of trading rules directly on your TradingView chart.
1. Customizable Settings:
• Positioning : Place the table in one of nine positions on the chart (e.g., bottom left, top right).
• Header : Modify the banner text, size, and color.
• Row Content : Define text for each row and control visibility.
• Appearance : Adjust text and background colors.
2. Checklist Table:
•Displays up to 8 rows with checkboxes (✅/❌) and custom labels for trade evaluation.
•Useful for tracking whether specific trade conditions or rules are met.
3. Trade Score Calculation:
•The Trade Score is a percentage that shows how many of your checklist items are checked compared to the total visible items.
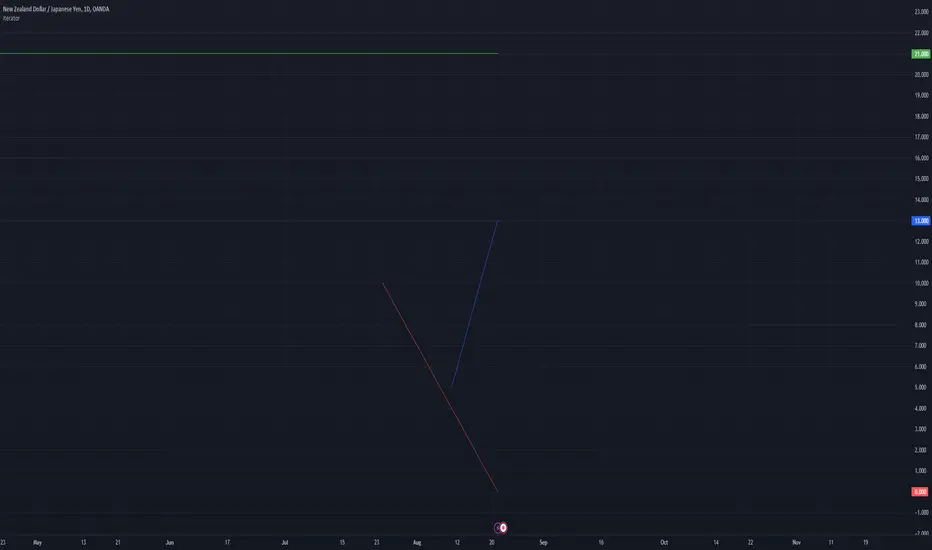
iteratorThe "Iterator" library is designed to provide a flexible way to work with sequences of values. This library offers a set of functions to create and manage iterators for various data types, including integers, floats, and more. Whether you need to generate an array of values with specific increments or iterate over elements in reverse order, this library has you covered.
Key Features:
Array Creation: Easily generate arrays of integers or floats with customizable steps, both inclusive and exclusive of the end values.
Flexible Iteration: Includes methods to iterate over arrays of different types, such as booleans, integers, floats, strings, colors, and drawing objects like lines and labels.
Reverse Iteration: Support for reverse iteration, giving you control over the order in which elements are processed.
Automatic Loop Control: One of the key advantages of this library is that when using the .iterate() method, it only loops over the array when there are values present. This means you don’t have to manually check if the array is populated before iterating, simplifying your code and reducing potential errors.
Versatile Use Cases: Ideal for scenarios where you need to loop over an array without worrying about empty arrays or checking conditions manually.
This library is particularly useful in cases where you need to perform operations on each element in an array, ensuring that your loops are efficient and free from unnecessary checks.
Library "iterator"
The "iterator" library provides a versatile and efficient set of functions for creating and managing iterators.
It allows you to generate arrays of integers or floats with customizable steps, both inclusive and exclusive of the end values.
The library also includes methods for iterating over various types, including booleans, integers, floats, strings, colors,
and drawing objects like lines and labels. With support for reverse iteration and flexible customization options.
iterator(stop, start, step)
Creates an array of integers from start to stop with a specified step, excluding the stop value.
Parameters:
stop (int) : The end value of the iterator, exclusive.
start (int) : The starting value of the iterator. Default is 0.
step (int) : The increment value for each step in the iterator. Default is 1. Must be greater than 0.
Returns: An array of integers incremented by the step value from start to stop. Will return and empty array if start = stop.
iterator(stop, start, step)
Creates an array of floats from start to stop with a specified step, excluding the stop value.
Parameters:
stop (float) : The end value of the iterator, exclusive.
start (float) : The starting value of the iterator. Default is 0.
step (float) : The increment value for each step in the iterator. Default is 1. Must be greater than 0.
Returns: An array of floats incremented by the step value from start to stop. Will return and empty array if start = stop.
iterator_inclusive(stop, start, step)
Creates an array of integers from start to stop with a specified step, including the stop value.
Parameters:
stop (int) : The end value of the iterator, inclusive.
start (int) : The starting value of the iterator. Default is 0.
step (int) : The increment value for each step in the iterator. Default is 1. Must be greater than 0.
Returns: An array of integers incremented by the step value from start to stop, including the stop value.
iterator_inclusive(stop, start, step)
Creates an array of floats from start to stop with a specified step, including the stop value.
Parameters:
stop (float) : The end value of the iterator, inclusive.
start (float) : The starting value of the iterator. Default is 0.
step (float) : The increment value for each step in the iterator. Default is 1. Must be greater than 0.
Returns: An array of floats incremented by the step value from start to stop, including the stop value.
itr(stop, start, step)
Creates an array of integers from start to stop with a specified step, excluding the stop value.
Parameters:
stop (int) : The end value of the iterator, exclusive.
start (int) : The starting value of the iterator. Default is 0.
step (int) : The increment value for each step in the iterator. Default is 1. Must be greater than 0.
Returns: An array of integers incremented by the step value from start to stop.
itr(stop, start, step)
Creates an array of floats from start to stop with a specified step, excluding the stop value.
Parameters:
stop (float) : The end value of the iterator, exclusive.
start (float) : The starting value of the iterator. Default is 0.
step (float) : The increment value for each step in the iterator. Default is 1. Must be greater than 0.
Returns: An array of floats incremented by the step value from start to stop.
itr_in(stop, start, step)
Creates an array of integers from start to stop with a specified step, including the stop value.
Parameters:
stop (int) : The end value of the iterator, inclusive.
start (int) : The starting value of the iterator. Default is 0.
step (int) : The increment value for each step in the iterator. Default is 1. Must be greater than 0.
Returns: An array of integers incremented by the step value from start to stop, including the stop value.
itr_in(stop, start, step)
Creates an array of floats from start to stop with a specified step, including the stop value.
Parameters:
stop (float) : The end value of the iterator, inclusive.
start (float) : The starting value of the iterator. Default is 0.
step (float) : The increment value for each step in the iterator. Default is 1. Must be greater than 0.
Returns: An array of floats incremented by the step value from start to stop, including the stop value.
method iterate(self, reverse)
Creates an iterator array for the indices of ana array, with an option to reverse the order.
Namespace types: array
Parameters:
self (array) : The array to iterate over.
reverse (bool) : A boolean flag indicating whether to reverse the iterator order. Default is false.
Returns: An array of integers representing the indices of the array. The order can be reversed if specified.
method iterate(self, reverse)
Creates an iterator array for the indices of ana array, with an option to reverse the order.
Namespace types: array
Parameters:
self (array) : The array to iterate over.
reverse (bool) : A boolean flag indicating whether to reverse the iterator order. Default is false.
Returns: An array of integers representing the indices of the array. The order can be reversed if specified.
method iterate(self, reverse)
Creates an iterator array for the indices of ana array, with an option to reverse the order.
Namespace types: array
Parameters:
self (array) : The array to iterate over.
reverse (bool) : A boolean flag indicating whether to reverse the iterator order. Default is false.
Returns: An array of integers representing the indices of the array. The order can be reversed if specified.
method iterate(self, reverse)
Creates an iterator array for the indices of ana array, with an option to reverse the order.
Namespace types: array
Parameters:
self (array) : The array to iterate over.
reverse (bool) : A boolean flag indicating whether to reverse the iterator order. Default is false.
Returns: An array of integers representing the indices of the array. The order can be reversed if specified.
method iterate(self, reverse)
Creates an iterator array for the indices of ana array, with an option to reverse the order.
Namespace types: array
Parameters:
self (array) : The array to iterate over.
reverse (bool) : A boolean flag indicating whether to reverse the iterator order. Default is false.
Returns: An array of integers representing the indices of the array. The order can be reversed if specified.
method iterate(self, reverse)
Creates an iterator array for the indices of ana array, with an option to reverse the order.
Namespace types: array
Parameters:
self (array) : The array to iterate over.
reverse (bool) : A boolean flag indicating whether to reverse the iterator order. Default is false.
Returns: An array of integers representing the indices of the array. The order can be reversed if specified.
method iterate(self, reverse)
Creates an iterator array for the indices of ana array, with an option to reverse the order.
Namespace types: array
Parameters:
self (array) : The array to iterate over.
reverse (bool) : A boolean flag indicating whether to reverse the iterator order. Default is false.
Returns: An array of integers representing the indices of the array. The order can be reversed if specified.
method iterate(self, reverse)
Creates an iterator array for the indices of ana array, with an option to reverse the order.
Namespace types: array
Parameters:
self (array) : The array to iterate over.
reverse (bool) : A boolean flag indicating whether to reverse the iterator order. Default is false.
Returns: An array of integers representing the indices of the array. The order can be reversed if specified.
method iterate(self, reverse)
Creates an iterator array for the indices of ana array, with an option to reverse the order.
Namespace types: array
Parameters:
self (array) : The array to iterate over.
reverse (bool) : A boolean flag indicating whether to reverse the iterator order. Default is false.
Returns: An array of integers representing the indices of the array. The order can be reversed if specified.
method iterate(self, reverse)
Creates an iterator array for the indices of ana array, with an option to reverse the order.
Namespace types: array
Parameters:
self (array) : The array to iterate over.
reverse (bool) : A boolean flag indicating whether to reverse the iterator order. Default is false.
Returns: An array of integers representing the indices of the array. The order can be reversed if specified.
method iterate(self, reverse)
Creates an iterator array for the indices of ana array, with an option to reverse the order.
Namespace types: array
Parameters:
self (array) : The array to iterate over.
reverse (bool) : A boolean flag indicating whether to reverse the iterator order. Default is false.
Returns: An array of integers representing the indices of the array. The order can be reversed if specified.
method iterate(self, reverse)
Creates an iterator array for the indices of ana array, with an option to reverse the order.
Namespace types: array
Parameters:
self (array) : The array to iterate over.
reverse (bool) : A boolean flag indicating whether to reverse the iterator order. Default is false.
Returns: An array of integers representing the indices of the array. The order can be reversed if specified.
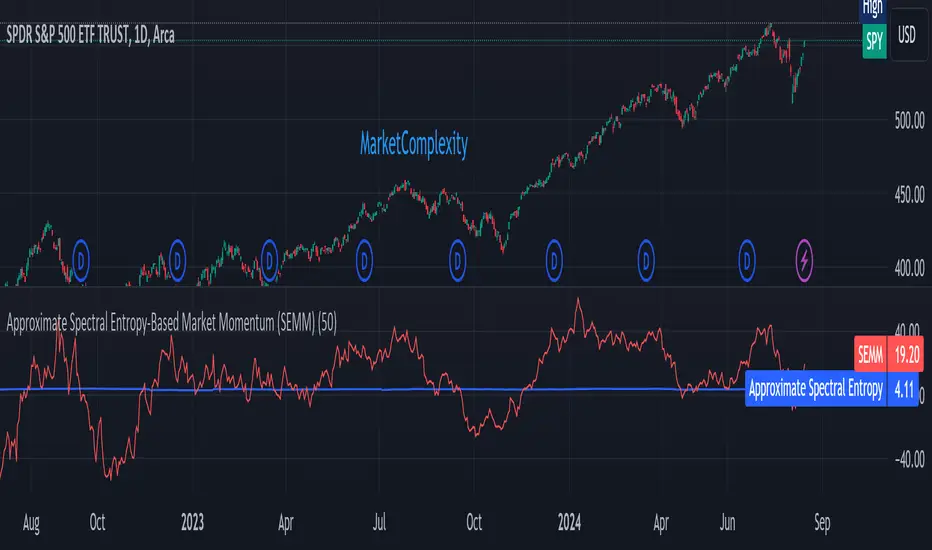
Approximate Spectral Entropy-Based Market Momentum (SEMM)Overview
The Approximate Spectral Entropy-Based Market Momentum (SEMM) indicator combines the concepts of spectral entropy and traditional momentum to provide traders with insights into both the strength and the complexity of market movements. By measuring the randomness or predictability of price changes, SEMM helps traders understand whether the market is in a trending or consolidating state and how strong that trend or consolidation might be.
Key Features
Entropy Measurement: Calculates the approximate spectral entropy of price movements to quantify market randomness.
Momentum Analysis: Integrates entropy with rate-of-change (ROC) to highlight periods of strong or weak momentum.
Dynamic Market Insight: Provides a dual perspective on market behavior—both the trend strength and the underlying complexity.
Customizable Parameters: Adjustable window length for entropy calculation, allowing for fine-tuning to suit different market conditions.
Concepts Underlying the Calculations
The indicator utilizes Shannon entropy, a concept from information theory, to approximate the spectral entropy of price returns. Spectral entropy traditionally involves a Fourier Transform to analyze the frequency components of a signal, but due to Pine Script limitations, this indicator uses a simplified approach. It calculates log returns over a rolling window, normalizes them, and then computes the Shannon entropy. This entropy value represents the level of disorder or complexity in the market, which is then multiplied by traditional momentum measures like the rate of change (ROC).
How It Works
Price Returns Calculation: The indicator first computes the log returns of price data over a specified window length.
Entropy Calculation: These log returns are normalized and used to calculate the Shannon entropy, representing market complexity.
Momentum Integration: The calculated entropy is then multiplied by the rate of change (ROC) of prices to generate the SEMM value.
Signal Generation: High SEMM values indicate strong momentum with higher randomness, while low SEMM values indicate lower momentum with more predictable trends.
How Traders Can Use It
Trend Identification: Use SEMM to identify strong trends or potential trend reversals. Low entropy values can indicate a trending market, whereas high entropy suggests choppy or consolidating conditions.
Market State Analysis: Combine SEMM with other indicators or chart patterns to confirm the market's state—whether it's trending, ranging, or transitioning between states.
Risk Management: Consider high SEMM values as a signal to be cautious, as they suggest increased market unpredictability.
Example Usage Instructions
Add the Indicator: Apply the "Approximate Spectral Entropy-Based Market Momentum (SEMM)" indicator to your chart.
Adjust Parameters: Modify the length parameter to suit your trading timeframe. Shorter lengths are more responsive, while longer lengths smooth out the signal.
Analyze the Output: Observe the blue line for entropy and the red line for SEMM. Look for divergences or confirmations with price action to guide your trades.
Combine with Other Tools: Use SEMM alongside moving averages, support/resistance levels, or other indicators to build a comprehensive trading strategy.
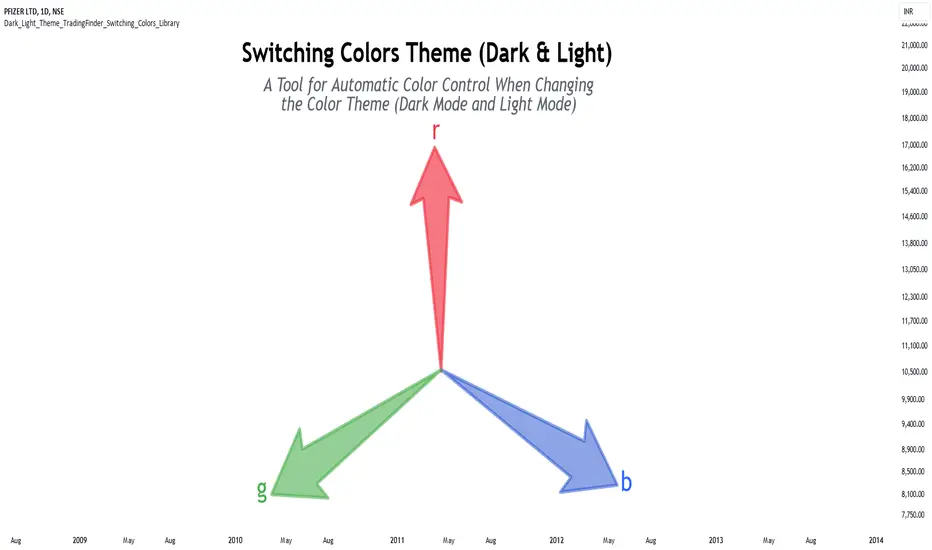
Dark & Light Theme [TradingFinder] Switching Colors Library🔵 Introduction
One of the challenges of script users is matching the colors used in indicators or strategies. By default, colors are chosen to display based on either the dark theme or the light theme.
In scripts with a large number of colors used, changing all colors to better display in dark mode or light mode can be a difficult and tedious process.
This library provides developers with the ability to adjust the colors used in their scripts based on the theme of the display.
🔵 Logic
To categorize the color spectrum, the range from 0 to 255 of all three main colors red, green and blue was divided into smaller ranges.
Blue color, which is more effective in darkening or lightening colors, is divided into 8 categories, red color into 5 categories, and green color into 3 categories, because it has little effect on darkening or brightening colors.
The combination of these categories creates 120 different modes for the color range, which leads to a more accurate identification of the color and its brightness, and helps to decide how to change it.
Except for these 120 modes, there are 2 other modes that are related to colors almost white or black, which makes a total of 122 modes.
🔵 How to Use
First, you can add the library to your code as shown in the example below.
import TFlab/Dark_Light_Theme_TradingFinder_Switching_Colors_Library/1 as SC
🟣 Parameters
SwitchingColorMode(Color, Mode) =>
Parameters:
Color (color)
Mode (string)
Color : In this parameter, enter the color you want to adjust based on light mode and dark mode.
Mode : Three modes "Off", "Light" and "Dark" are included in this parameter. "Light" mode is for color adjustment for use in "Light Mode".
"Dark" mode is for color adjustment for use in "Dark Mode" and "Off" mode turns off the color adjustment function and the input color to the function is the same as the output color.
🔵 Function Outputs
OriginalColor = input.color(color.red)
= SC.SwitchingColorMode(OriginalColor, Mode)
Multi-Frame Market Sentiment DashboardOverview
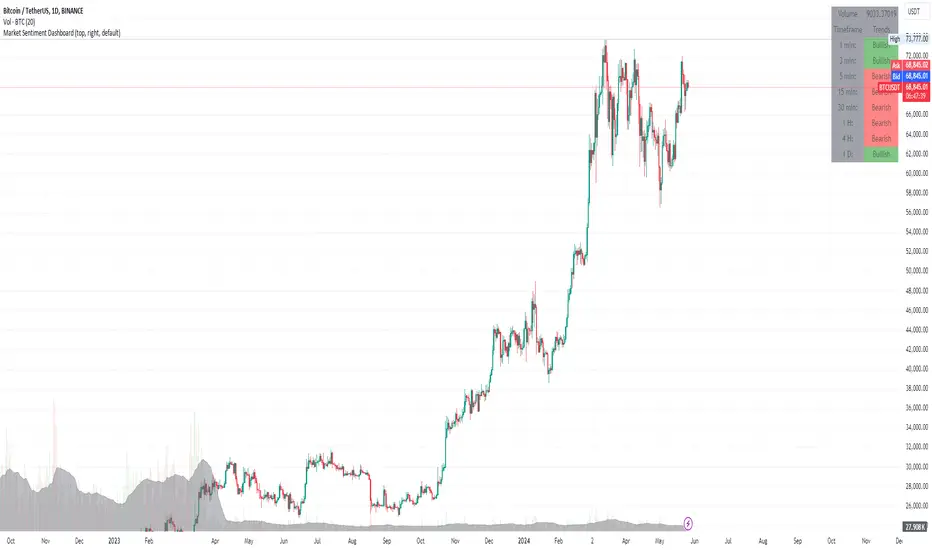
This Pine Script™ code generates a "Market Sentiment Dashboard" on TradingView, providing a visual summary of market sentiment across multiple timeframes. This tool aids traders in making informed decisions by displaying real-time sentiment analysis based on Exponential Moving Averages (EMA).
Key Features
Panel Positioning:
Custom Placement: Traders can position the dashboard at the top, middle, or bottom of the chart and align it to the left, center, or right, ensuring optimal integration with other chart elements.
Customizable Colors:
Sentiment Colors: Users can define colors for bullish, bearish, and neutral market conditions, enhancing the dashboard's readability.
Text Color: Customizable text color ensures clarity against various background colors.
Label Size:
Scalable Labels: Adjustable label sizes (from very small to very large) ensure readability across different screen sizes and resolutions.
Market Sentiment Calculation:
EMA-Based Sentiment: The dashboard calculates sentiment using a 9-period EMA. If the EMA is higher than two bars ago, the sentiment is bullish; if lower, it's bearish; otherwise, it's neutral.
Multiple Timeframes: Sentiment is calculated for several timeframes: 1 minute, 3 minutes, 5 minutes, 15 minutes, 30 minutes, 1 hour, 4 hours, and 1 day. This broad analysis provides a comprehensive view of market conditions.
Dynamic Table:
Structured Display: The dashboard uses a table to organize and display sentiment data clearly.
Real-Time Updates: The table updates in real-time, providing traders with up-to-date market information.
How It Works
EMA Calculation: The script requests EMA(9) values for each specified timeframe and compares the current EMA with the EMA from two bars ago to determine market sentiment.
Color Coding: Depending on the sentiment (Bullish, Bearish, or Neutral), the corresponding cell in the table is color-coded using predefined colors.
Table Display: The table displays the timeframe and corresponding sentiment, allowing traders to quickly assess market trends.
Benefits to Traders
Quick Assessment: Traders can quickly evaluate market sentiment across multiple timeframes without switching charts or manually calculating indicators.
Enhanced Visualization: The color-coded sentiment display makes it easy to identify trends at a glance.
Multi-Timeframe Analysis: Provides a broad view of short-term and long-term market trends, helping traders confirm trends and avoid false signals.
This dashboard enhances the overall trading experience by providing a comprehensive, customizable, and easy-to-read summary of market sentiment.
Usage Instructions
Add the Script to Your Chart: Apply the "Market Sentiment Dashboard" indicator to your TradingView chart.
Customize Settings: Adjust the panel position, colors, and label sizes to fit your preferences.
Interpret Sentiment: Use the color-coded table to quickly understand the market sentiment across different timeframes and make informed trading decisions.
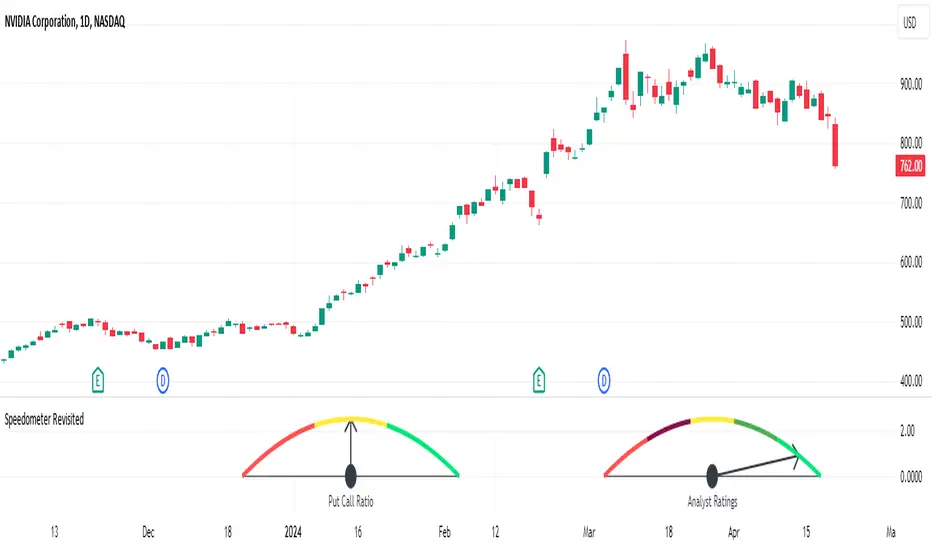
Speedometer RevisitedSpeedometer Revisited is a new way to draw custom metric speedometers and is intended to be a utility for other coders to use.
@rumpypumpydumpy originally introduced the Speedometer Toolkit in version 4 of Pine Script. Since then, Pine Script has been updated to version 5, introducing some amazing new features such as polylines and chart.points. This indicator is an example of what can be done with these newer features.
The indicator starts off with a handful of functions that will be used to create the drawings. Notes are left throughout the code explaining what each line of the functions does. My goal was to make these functions user-friendly and somewhat easy to understand. I then demonstrate two examples: one speedometer with five segments and another with three.
The first example demonstrates how to visually represent the analysts' ratings for a stock using the built-in syminfo.recommendations. The speedometer is divided into five segments, each representing a different level of analyst recommendation: strong sell, sell, hold, buy, and strong buy.
Each segment is drawn using a polyline from the createSeg function, with colors assigned as follows:
Red for 'Strong Sell'
Maroon for 'Sell'
Yellow for 'Hold'
Green for 'Buy'
Lime for 'Strong Buy'
The script identifies the maximum value among the analyst ratings, calculates the midpoint of the corresponding segment, and draws a needle pointing to this midpoint.
The second example employs the speedometer design to display market sentiment through the put-call ratio. The put-call ratio is a gauge of investor sentiment, where values above 1 indicate a bearish sentiment (more puts being bought relative to calls), and values below 1 suggest a bullish outlook (more calls being bought relative to puts).
The speedometer is divided into three segments, reflecting different ranges of the put-call ratio:
Red for a ratio greater than 1 (bearish sentiment)
Yellow for a ratio between 0.8 and 1 (neutral to bearish sentiment)
Lime for a ratio less than 0.8 (bullish sentiment)
Depending on the value of the put-call ratio, the script calculates which segment the current value falls into and determines the appropriate segment number. The script calculates the midpoint of the selected segment and draws a needle pointing to this value.
Both examples show how the speedometer can be used as a visual indicator of certain market conditions, helping traders quickly recognize trends and adjust their strategies accordingly.
A big thanks to @rumpypumpydumpy for his original Speedometer Toolbox. I hope this take on it can be useful for other coders.
FreedX Grid Backtest█ FreedX Grid Backtest is an open-source tool that offers accurate GRID calculations for GRID trading strategies. This advanced tool allows users to backtest GRID trading parameters with precision, accurately reflecting exchange functionalities. We are committed to enhancing trading strategies through precise backtesting solutions and address the issue of unreliable backtesting practices observed on GRID trading strategies. FreedX Grid Backtest is designed for optimal calculation speed and plotting efficiency, ensuring users to achieve fastest calculations during their analysis.
█ GRID TRADING STRATEGY SETTINGS
The core of the FreedX Grid Backtest tool lies in its ability to simulate grid trading strategies. Grid trading involves placing orders at regular intervals within a predefined price range, creating a grid of orders that capitalize on market volatility.
Features:
⚙️ Backtest Range:
→ Purpose: Allows users to specify the backtesting range of GRID strategy. Closes all positions at the end of this range.
→ How to Use: Drag the dates to fit the desired backtesting range.
⚙️ Investment & Compounding:
→ Purpose: Allows users to specify the total investment amount and select between fixed and compound investment strategies. Compounding adjusts trade quantities based on performance, enhancing the grid strategy's adaptability to market changes.
→ How to Use: Set the desired investment amount and choose between "Fixed" or "Compound" for the investment method.
⚙️ Leverage & Grid Levels:
→ Purpose: Leverage amplifies the investment amount, increasing potential returns (and risks). Users can define the number of grid levels, which determines how the investment is distributed across the grid.
→ How to Use: Input the desired leverage and number of grids. The tool automatically calculates the distribution of funds across each grid level.
⚙️ Distribution Type & Mode:
→ Purpose: Users can select the distribution type (Arithmetic or Geometric) to set how grid levels are determined. The mode (Neutral, Long, Short) dictates the direction of trades within the grid.
→ How to Use: Choose the distribution type and mode based on the desired trading strategy and market outlook.
⚙️ Enable LONG/SHORT Grids exclusively:
█ MANUAL LEVELS AND STOP TRIGGERS
Beyond automated settings, the tool offers manual adjustments for traders seeking finer control over their grid strategies.
Features:
⚙️ Manual Level Adjustment:
→ Purpose: Enables traders to manually set the top, reference, and bottom levels of the grid, offering precision control over the trading range.
→ How to Use: Activate manual levels and adjust the top, reference, and bottom levels as needed to define the grid's scope.
⚙️ Stop Triggers:
→ Purpose: Provides an option to set upper and lower price limits, acting as stop triggers to close or terminate trades. This feature safeguards investments against significant market movements outside the anticipated range.
→ How to Use: Enable stop triggers and specify the upper and lower limits. The tool will automatically manage positions based on these parameters.
---
This guide gives you a quick and clear overview of the FreedX Grid Backtest tool, explaining how you can use this cutting-edge tool to improve your trading strategies.

Volume Spike IndicatorHello dear traders,
Today we're discussing an indicator I've coded: the Volume Spike Indicator (VSI).
The indicator isn't a groundbreaking invention and certainly not a novelty. Nevertheless, I haven't seen this version of the indicator on TradingView before, so I'd like to introduce it.
1. The Origin of the Idea:
We're all familiar with volume charts: A volume chart visually represents the trading activity for a specific asset over a certain period, indicating the total number of shares or contracts traded.
We also know that volume spikes can significantly impact the market. A volume spike represents an extreme anomaly, a day, week, or month with an extraordinary amount of trading. However, recognizing these spikes in practice isn't always straightforward. What constitutes high volume? How do we define and identify it? The answers to these questions aren't easy.
It's commonly said that a volume spike could be identified if the volume is 25% more than the average of the two weeks prior, but how do you measure this 25%? It's not always easy to calculate, especially in real-time.
This challenge led me to develop the concept into an indicator.
How Does It Work?
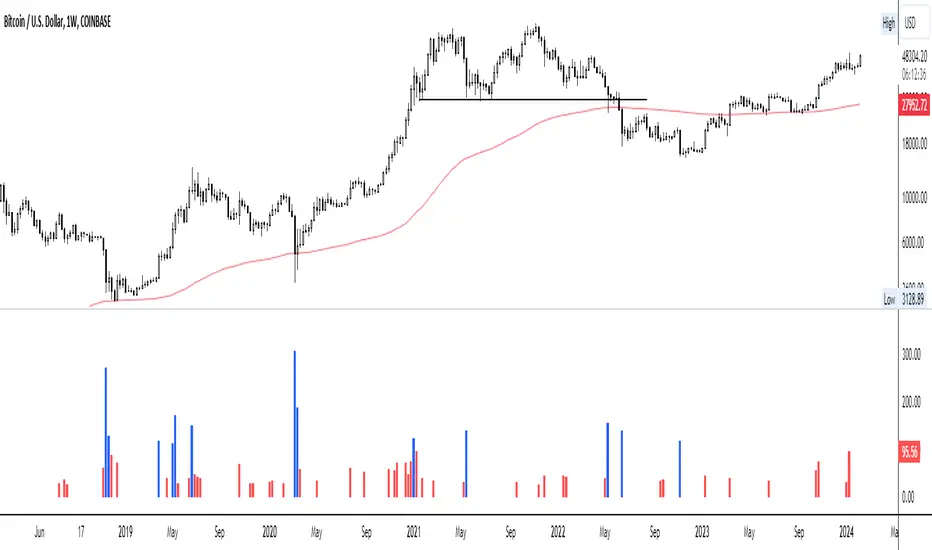
Imagine being able to "feel" the market's energy like a surfer feels the ocean. The VSI does something similar by examining trading volume and comparing it to what has been typical over the past few weeks. Here's a quick look at the magic behind it:
Step 1: Establishing the Baseline: We start by establishing a baseline, i.e., the average trading volume over a given period. Let's use the last 10 days as the default setting. We choose 10 days because, in the traditional stock market, 10 days represent two weeks if you subtract weekends. This gives us a fixed line to compare against.
Step 2: Recognizing Peaks: Next, we look for days when the trading volume significantly exceeds this average. The size of the jump is where you have a say. You can set a threshold, such as 25%, to define what you consider a volume spike.
Step 3: The Calculation: This is where the math comes into play. We calculate the percentage change in today's volume compared to the average volume of the last 10 days. For example, if today's volume is 30% above the average and you've set your threshold at 25%, the VSI will recognize this as a spike.
Step 4: Visual Cue: These spikes are then plotted on a graph, with each spike represented as a bar. The height of the bar indicates the spike's percentage size, so you can see at a glance how significant a spike is.
Step 5: Intuitive Color Coding: For quick analysis, the VSI employs a color-coding system. Exceptionally high peaks, such as those exceeding a 100% increase, are highlighted in blue to emphasize their importance. Other peaks are shown in red, creating a visual hierarchy for quick volume data interpretation.
Why This Matters:
Identifying these spikes can help pinpoint the beginning or end of a trend. The idea is that when trading peaks at a certain level, there might be no more buyers or sellers willing to engage at that price level. Volume peaks, and a reversal is likely imminent. It's a simple yet effective concept. Therefore, it's crucial to use this indicator in the context of the trend, as not every spike carries the same significance.
Customizable:
The beauty of the VSI lies in its flexibility. Trading futures? You might want to adjust the averaging period to 14 days to better suit your market. You have full control over the settings to tailor them to your trading style.
Interpreting the Figures:
A positive percentage indicates a volume spike above the average – the higher the percentage, the more significant the spike.
If the percentage exceeds a certain threshold (which you can set, e.g., 25%), it signals a volume spike, indicating increased market activity that could precede significant price movement.
What makes the VSI genuinely adaptable is your ability to tweak the parameters to suit your needs.
Are you trading in a volatile market? Extend the SMA period to smooth out the noise. Trading in a 24-hour market? Adjust the length of your SMA. Seeking finer details? Shorten it. The VSI is yours to adapt to your trading strategy.
---------------------------------------------------------------------------------------------------------------------
As we wrap up this introduction to the Volume Spike Indicator, I hope you're as excited about its potential as I am. This tool, born out of curiosity and a desire for clarity in the vast ocean of market data, is designed to be your ally in navigating the waves of trading activity.
Remember, the true power of the VSI lies not just in its ability to highlight significant volume spikes, but in its adaptability to your unique trading style and needs. Whether you're charting courses through the tumultuous seas of day trading or navigating the broader currents of long-term investments, the VSI is here to offer insights and guidance.
I encourage you to experiment with it, customize it, and see how it can enhance your trading strategy. And as you do, remember that every tool, no matter how powerful, is just one piece of the puzzle. Combine the VSI with your knowledge, experience, and intuition to make informed and strategic trading decisions.
Thank you for taking the time to explore the Volume Spike Indicator with me.
Best Regards,
Karim Subhieh
Liquidity Heatmap [BigBeluga]The Liquidity Heatmap is an indicator designed to spot possible resting liquidity or potential stop loss using volume or Open interest.
The Open interest is the total number of outstanding derivative contracts for an asset—such as options or futures—that have not been settled. Open interest keeps track of every open position in a particular contract rather than tracking the total volume traded.
The Volume is the total quantity of shares or contracts traded for the current timeframe.
🔶 HOW IT WORKS
Based on the user choice between Volume or OI, the idea is the same for both.
On each candle, we add the data (volume or OI) below or above (long or short) that should be the hypothetical liquidation levels; More color of the liquidity level = more reaction when the price goes through it.
Gradient color is calculated between an average of 2 points that the user can select. For example: 500, and the script will take the average of the highest data between 500 and 250 (half of the user's choice), and the gradient will be based on that.
If we take volume as an example, a big volume spike will mean a lot of long or short activity in that candle. A liquidity level will be displayed below/above the set leverage (4.5 = 20x leverage as an example) so when the price revisits that zone, all the 20x leverage should be liquidated.
Huge volume = a lot of activity
Huge OI = a lot of positions opened
More volume / OI will result in a stronger color that will generate a stronger reaction.
🔶 ROUTE
Here's an example of a route for long liquidity:
Enable the filter = consider only green candles.
Set the leverage to 4.5 (20x).
Choose Data = Volume.
Process:
A green candle is formed.
A liquidity level is established.
The level is placed below to simulate the 20x leverage.
Color is applied, considering the average volume within the chosen area.
Route completed.
🔶 FEATURE
Possibility to change the color of both long and short liquidity
Manual opacity value
Manual opacity average
Leverage
Autopilot - set a good average automatically of the opacity value
Enable both long or short liquidity visualization
Filtering - grab only red/green candle of the corresponding side or grab every candle
Data - nzVolume - Volume - nzOI - OI
🔶 TIPS
Since the limit of the line is 500, it's best to plot 2 scripts: one with only long and another with only short.
🔶 CONCLUSION
The liquidity levels are an interesting way to think about possible levels, and those are not real levels.

Flag FinderFlag Finder Indicator is a technical analysis tool to identify bull and bear flags.
What are flags
Flags are continuation patterns that occur within the general trend of the security. A bull flag represents a temporary pause or consolidation before price resumes it's upward movement, while a bear flag occurs before price continues its downward movement.
Both flag patterns consist of two components:
The Pole
The Flag
The pole is the initial strong upward surge or decline that precedes the flag. The pole is usually a fast move accompanied by heavy volume signaling significant buying or selling pressure.
The flag is then formed as price consolidates after the initial surge or decline from the pole. For a bull flag price will drift slightly downward to sideways, a bear flag will drift upward to sideways. The best flags often see volume dry up during this phase of the pattern.
Indicator Settings
Both components are fully customizable in the indicator so the user can adjust for any time frame or volatility. Select the minimum and maximum accepted limits from the % gain loss required for the pole, the maximum acceptable flag depth or rally and the minimum and maximum number of bars for each component.
Colors and what components are visible at any time are also user controlled.
Trading flags
Traders typically use flags to enter on breakouts. A breakout occurs when price moves above the left side high of a bull flag or below the left side low of a bear flag.
Alerts
The Flag Finder allows for four different types of alerts
New Bull Flag
New Bear Flag
Bull Flag Breakout
Bear Flag Breakout
Pine Script
On top of the indicator identifying bull and bear flags, throughout the source code I left notes on nearly every line to help anyone who is interested in pine script see my thought process and explain which each line of code does. This code isn't too complex, but it offers a look into many different concepts one might use when writing pinescript such as:
input groups
declaring and reassigning variables
for loops
plotshapes & lines
alerts


Mizar_LibraryThe "Mizar_Library" is a powerful tool designed for Pine Script™ programmer’s, providing a collection of general functions that facilitate the usage of Mizar’s DCA (Dollar-Cost-Averaging) bot system.
To begin using the Mizar Library, you first need to import it into your indicator script. Insert the following line below your indicator initiation line: import Mizar_Trading/Mizar_Library/1 as mizar (mizar is the chosen alias).
In the import statement, Mizar_Trading.Mizar_Library_v1 refers to the specific version of the Mizar Library you wish to use. Feel free to modify mizar to your preferred alias name.
Once the library is imported, you can leverage its functions by prefixing them with mizar. . This will prompt auto-completion suggestions displaying all the available user-defined functions provided by the Mizar Library.
Now, let's delve into some of the key functions available in the Mizar Library:
DCA_bot_msg(_cmd)
The DCA_bot_msg function accepts an user-defined type (UDT) _cmd as a parameter and returns a string with the complete JSON command for a Mizar DCA bot.
Parameters:
_cmd (bot_params) : ::: User-defined type (UDT) that holds all the necessary information for the bot command.
Returns: A string with the complete JSON command for a Mizar DCA bot.
rounding_to_ticks(value, ticks, rounding_type)
The rounding_to_ticks function rounds a calculated price to the nearest actual price based on the specified tick size.
Parameters:
value (float) : ::: The calculated price as float type, to be rounded to the nearest real price.
ticks (float) : ::: The smallest possible price obtained through a request in your script.
rounding_type (int) : ::: The rounding type for the price: 0 = closest real price, 1 = closest real price above, 2 = closest real price below.
Returns: A float value representing the rounded price to the next tick.
bot_params
Bot_params is an user-defined type (UDT) that represents the parameters required for a Mizar DCA bot.
Fields:
bot_id (series string) : The ID number of your Mizar DCA bot.
api_key (series string) : Your private API key from your Mizar account (keep it confidential!).
action (series string) : The command to perform: "open" (standard) or "close" optional .
tp_perc (series string) : The take profit percentage in decimal form (1% = "0.01") optional .
base_asset (series string) : The cryptocurrency you want to buy (e.g., "BTC").
quote_asset (series string) : The coin or fiat currency used for payment (e.g., "USDT" is standard if not specified) optional .
direction (series string) : The direction of the position: "long" or "short" (only applicable for two-way hedge bots) optional .
To obtain the JSON command string for the alert_function call, you can use the DCA_bot_msg function provided by the library. Simply pass the cmd_msg UDT as an argument and assign the returned string value to a variable.
Here's an example to illustrate the process:
// Import of the Mizar Library to use the included functions
import/Mizar_Trading/Mizar_Library/1 as mizar
// Example to set a variable called “cmd_msg” and all of its parameters
cmd_msg = mizar.bot_params. new()
cmd_msg.action := "open"
cmd_msg.api_key := "top secret"
cmd_msg.bot_id := "9999"
cmd_msg.base_asset := "BTC"
cmd_msg.quote_asset := "USDT"
cmd_msg.direction := "long"
cmd_msg.tp_perc := "0.015"
// Calling the Mizar conversion function named “DCA_bot_msg()” with the cmd_msg as argument to receive the JSON command and save it in a string variable called “alert_msg”
alert_msg = mizar.DCA_bot_msg(cmd_msg)
Feel free to utilize (series) string variables instead of constant strings. By incorporating the Mizar Library into your Pine Script, you gain access to a powerful set of functions and can leverage them according to your specific requirements.
For additional help or support, you can join the Mizar Discord channel. There, you'll find a dedicated Pine Script channel where you can ask any questions related to Pine Script.
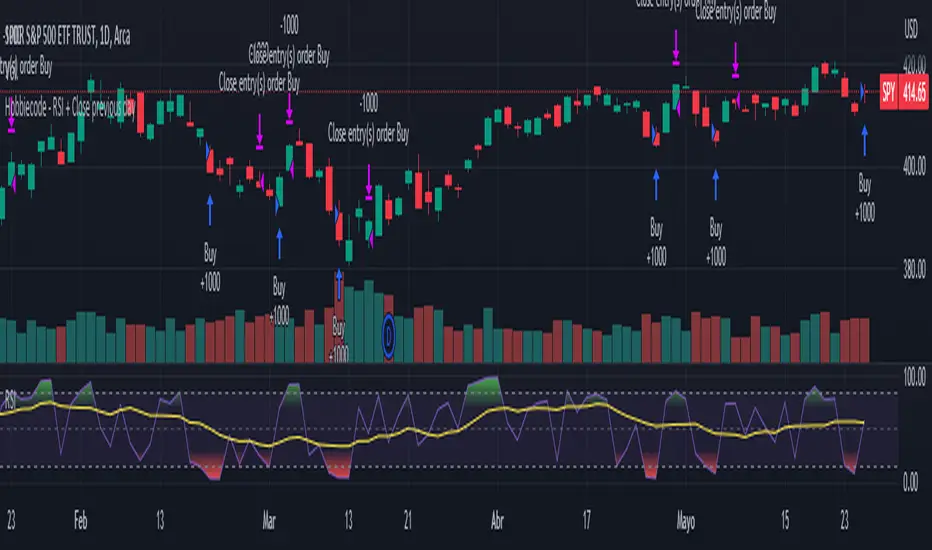
Hobbiecode - RSI + Close previous dayThis is a simple strategy that is working well on SPY but also well performing on Mini Futures SP500. The strategy is composed by the followin rules:
1. If RSI(2) is less than 15, then enter at the close.
2. Exit on close if today’s close is higher than yesterday’s high.
If you backtest it on Mini Futures SP500 you will be able to track data from 1993. It is important to select D1 as timeframe.
Please share any comment or idea below.
Have a good trading,
Ramón.
Hobbiecode - Five Day Low RSI StrategyThis is a simple strategy that is working well on SPY but also well performing on Mini Futures SP500. The strategy is composed by the followin rules:
1. If today’s close is below yesterday’s five-day low, go long at the close.
2. Sell at the close when the two-day RSI closes above 50.
3. There is a time stop of five days if the sell criterium is not triggered.
If you backtest it on Mini Futures SP500 you will be able to track data from 1993. It is important to select D1 as timeframe.
Please share any comment or idea below.
Have a good trading,
Ramón.

Hobbiecode - SP500 IBS + HigherThis is a simple strategy that is working well on SPY but also well performing on Mini Futures SP500. The strategy is composed by the followin rules:
1. Today is Monday.
2. The close must be lower than the close on Friday.
3. The IBS must be below 0.5.
4. If 1-3 are true, then enter at the close.
5. Sell 5 trading days later (at the close).
If you backtest it on Mini Futures SP500 you will be able to track data from 1993. It is important to select D1 as timeframe.
Please share any comment or idea below.
Have a good trading,
Ramón.

PSESS1 - Learn PineScript InputsThis is a script written exclusively for people who are trying to learn Pine Script.
PSESS stands for "Pine Script Educational Script Series" which is a series of scripts that helps Pine Script programmers in 2 ways:
1. Learn Pine Script at more depth by an interactive environment where they can immediately see the effects of any change in the pre-written code and also comparing different lines code having tiny differences so they can grasp the details.
2. Have this script open while coding in order to copy the line they find useful
Pine Script Library couldn't be used for this purpose since this script has educational aspect and needs to be executable individually.
This is Script 1 of PSESS and focuses on inputs in Pine Script.
The script is densly commented in order to make it understandable. here is the outline of the script:
1. Inputs that can be received through the indicator() function
2. 12 possible types of input
3. Input() function arguments: defval - title - tooltip - inline - group - confirm
4. The different display of tooltip when inputs are inline
5. Multiple price and time inputs (on single request or multiple requests)
6. What happens when title argument is not specified
7. References and key points from them

Number Formatting Indian/USAThis is a Pine script that helps traders format numbers in different ways to make it easier to read and display big numbers on TradingView.
this script is specifically to help other fellow pinecoder. Its not a indicator.
The above code is an example of how to format numbers in TradingView using two different formats: Indian and USA. The code defines a function called `formatNumber()` which takes two arguments: num (the number to format) and format (the format to use - either "Indian" or "USA").
If the "Indian" format is selected, the function rounds the number to the nearest crore, lakh or thousand and adds the appropriate suffix (i.e. "Cr", "Lac" or "K"). If the "USA" format is selected, the function rounds the number to the nearest billion, million or thousand and adds the appropriate suffix (i.e. "B", "M" or "K").
In both cases, the function then adds commas to the formatted number. The example usage shows how to call the `formatNumber()` function with a given number and format, and then plot the formatted number as a label on the chart.

Combined Strategy Trading Bot (RSI ADX 20SMA)Trading Bot V1, This code implements a combined trading strategy that uses several indicators and strategies to make buy and sell decisions in the market. The code is written in Pine Script™, which is a programming language used in the TradingView platform. By BraelonWhitfield.Eth
The strategy uses the Average Directional Movement Index (ADX) and the Pine SuperTrend indicator to identify trends and price movements in the market. The SuperTrend indicator is a popular technical analysis tool that helps to identify the direction of the current trend and provides entry and exit points for trades.
The strategy also uses the Relative Strength Index (RSI) to identify overbought and oversold conditions in the market. The RSI is a momentum indicator that measures the speed and change of price movements in the market.
The first part of the code defines the inputs for the ADX and DI Length, which are used to calculate the ADX and DI values. The dirmov() function is used to calculate the positive and negative directional indicators (plusDM and minusDM) based on the high and low prices. The truerange variable is then calculated using the True Range (TR) formula. Finally, the plus and minus variables are calculated using the smoothed moving average of the plusDM and minusDM values.
The adx() function is then used to calculate the ADX values based on the plus and minus variables. The Pine SuperTrend indicator is defined using the pine_supertrend() function. This function uses the high-low average (hl2) and the Average True Range (ATR) to calculate the upper and lower bands for the indicator. The direction of the current trend is then determined based on whether the current price is above or below the upper or lower bands.
The RSI values are then calculated using the ta.rsi() function, with the inputs for the close price and the RSI period. The overbought and oversold conditions are defined using the OB and OS inputs, which specify the threshold values for the RSI. The upTrend and downTrend variables are defined based on the direction of the Pine SuperTrend indicator.
The next part of the code defines the 20-period Simple Moving Average (SMA) using the ta.sma() function. The os and ob variables are then calculated based on the RSI values and the OB and OS inputs. The strategy.entry() function is used to define the buy and sell orders based on the upTrend and downTrend variables, as well as the Pine SuperTrend indicator, the 20-period SMA, and the os variable.
The final part of the code defines the Channel Breakout Strategy using the ta.highest() and ta.lowest() functions to calculate the upper and lower bounds of the channel. The strategy.entry() function is then used to define the buy and sell orders based on whether the current price is above or below the upper or lower bounds.
In summary, this code implements a combined trading strategy that uses several indicators and strategies to make buy and sell decisions in the market. The strategy is designed to identify trends and price movements in the market, as well as overbought and oversold conditions, to provide entry and exit points for trades. The strategy uses the Pine SuperTrend indicator, the ADX and DI indicators, the RSI, and the 20-period SMA, as well as the Channel Breakout Strategy to make informed trading decisions.

Dynamo
╭━━━╮
╰╮╭╮┃
╱┃┃┃┣╮╱╭┳━╮╭━━┳╮╭┳━━╮
╱┃┃┃┃┃╱┃┃╭╮┫╭╮┃╰╯┃╭╮┃
╭╯╰╯┃╰━╯┃┃┃┃╭╮┃┃┃┃╰╯┃
╰━━━┻━╮╭┻╯╰┻╯╰┻┻┻┻━━╯
╱╱╱╱╭━╯┃
╱╱╱╱╰━━╯
Overview
Dynamo is built to be the Swiss-knife for price-movement & strength detection, it aims to provide a holistic view of the current price across multiple dimensions. This is achieved by combining 3 very specific indicators(RSI, Stochastic & ADX) into a single view. Each of which serve a different purpose, and collectively provide a simple, yet powerful tool to gauge the true nature of price-action.
Background
Dynamo uses 3 technical analysis tools in conjunction to provide better insights into price movement, they are briefly explained below:
Relative Strength Index(RSI)
RSI is a popular indicator that is often used to measure the velocity of price change & the intensity of directional moves. RSI computes the relative strength of the current price by comparing the security’s bullish strength versus bearish strength for a given period, i.e. by comparing average gain to average loss.
It is a range bound(0-100) variable that generates a bullish reading if average gain is higher, and a bullish reading if average loss is higher. Values over 50 are generally considered bullish & values less than 50 indicate a bearish market. Values over 70 indicate an overbought condition, and values below 30 indicate oversold condition.
Stochastic
Stochastic is an indicator that aims to measure the momentum in the market, by comparing most recent closing price of the security to its price range for a given period. It is based on the assumption that price tends to close near the recent high in an up trend, and it closes near the recent low during a down trend.
It is also range bound(0-100), values over 80 indicate overbought condition and values below 20 indicate oversold condition.
Average Directional Index(ADX)
ADX is an indicator that can quantify trend strength, it is derived from two underlying indices, known as Directional Movement Index(DMI). +DMI represents strength of the up trend, and -DMI represents strength of the down trend, and ADX is the average of the two.
ADX is non-directional or trend-neutral, which means, it does not follow the direction of the price, instead ADX will rise only when there is a strong trend, it does not matter if it’s an up trend or a down trend. Typical ranges of ADX are 25-50 for a strong trend, anything below 25 is considered as no trend or weak trend. ADX can frequently shoot upto higher values, but it generally finds exhaustion levels around the 60-75 range.
About the script
All these indicators are very powerful tools, but just like any other indicator they have their limitations. Stochastic & ADX can generate false signals in volatile markets, meaning price wouldn’t always follow through with what’s being indicated. ADX may even fail to generate a signal in less volatile markets, simply because it is based on moving averages, it tends to react slower to price changes. RSI can also lose it’s effectiveness when markets are trending strong, as it can stay in the overbought or oversold ranges for an extended period of time.
Dynamo aims to provide the trader with a much broader perspective by bringing together these contrasting indicators into a single simplified view. When Stochastic becomes less reliable in highly volatile conditions, one can cross validate their deduction by looking at RSI patterns. When RSI gets stuck in overbought or oversold range, one can refer to ADX to get better picture about the current trend. Similarly, various combinations of rules & setups can be formulated to get a more deterministic view, when working with either of these indicators.
There many possible use cases for a tool like this, and it totally depends on how you want to use it. An obvious option is to use it to trigger signals only after it has been confirmed by two or more indicators, for example, RSI & Stochastic make a great combination for cross-over or cross-under strategies. Some of the other options include trend detection, strength detection, reversals or price rejection points, possible duration of a trend, and all of these can very easily be translated into effective entry and exit points for trades.
How to use it
Dynamo is an easy-to-use tool, just add it to your chart and you’re good to start with your market analysis. Output consists of three overlapping plots, each of which tackle price movement from a slightly different angle.
Stochastic: A momentum indicator that plots the current closing price in relation to the price-range over a given period of time.
Can be used to detect the direction of the price movement, potential reversals, or duration of an up/down move.
Plotted as grey coloured histograms in the background.
Relative Strength Index(RSI): RSI is also a momentum indicator that measures the velocity with which the price changes.
Can be used to detect the speed of the price movement, RSI divergences can be a nice way to detect directional changes.
Plotted as an aqua coloured line.
Average Directional Index(ADX): ADX is an indicator that is used to measure the strength of the current trend.
Can be used to measure how strong the price movement is, both up and down, or to establish long terms trends.
Plotted as an orange coloured line.
Features
Provides a well-rounded view of the market movement by amalgamating some of the best strength indicators, helping traders make better informed decisions with minimal effort.
Simplistic plots that aim to convey clean signals, as a result, reducing clutter on the chart, and hopefully in the trader's head too.
Combines different types of indicators into a single view, which leads to an optimised use of the precious screen real-estate.
Final Note
Dynamo is designed to be minimalistic in functionality and in appearance, as it is being built to be a general purpose tool that is not only beginner friendly, but can also be highly-configurable to meet the needs of pro traders.
Thresholds & default values for the indicators are only suggestions based on industry standards, they may not be an exact match for all markets & conditions. Hence, it is advisable for the user to test & adjust these values according their securities and trading styles.
The chart highlights one of many possible setups using this tool, and it can used to create various types of setups & strategies, but it is also worth noting that the usability & the effectiveness of this tool also depends on the user’s understanding & interpretation of the underlying indicators.
Lastly, this tool is only an indicator and should only be perceived that way. It does not guarantee anything, and the user should do their own research before committing to trades based on any indicator.

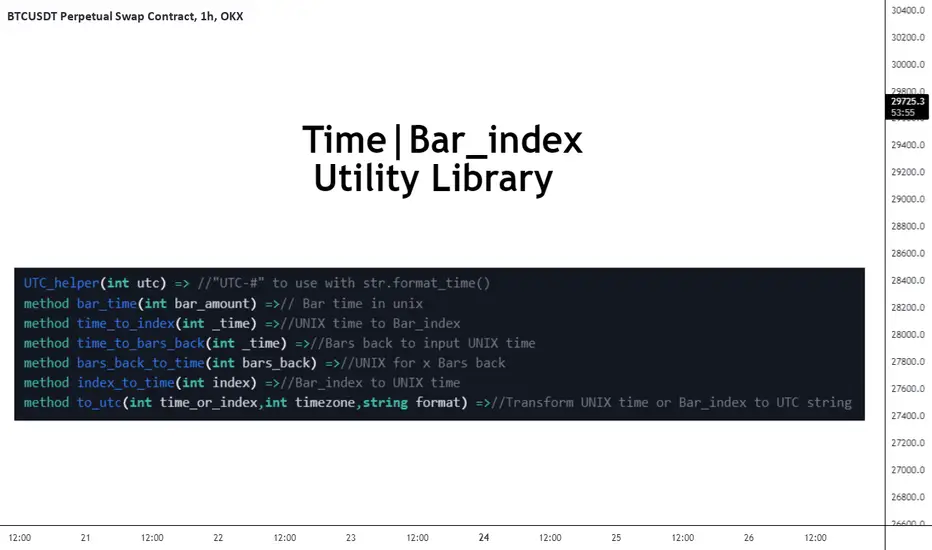
FrizLabz_Time_Utility_MethodsLibrary "FrizLabz_Time_Utility_Methods"
Some time to index and index to time helper methods made them for another library thought I would try to make
them as methods
UTC_helper(utc)
UTC helper function this adds the + to the positive utc times, add "UTC" to the string
and can be used in the timezone arg of for format_time()
Parameters:
utc : (int) | +/- utc offset
Returns: string | string to be added to the timezone paramater for utc timezone usage
bar_time(bar_amount)
from a time to index
Parameters:
bar_amount : (int) | default - 1)
Returns: int bar_time
time_to_index(_time)
from time to bar_index
Parameters:
_time : (int)
Returns: int time_to_index | bar_index that corresponds to time provided
time_to_bars_back(_time)
from a time quanity to bar quanity for use with .
Parameters:
_time : (int)
Returns: int bars_back | yeilds the amount of bars from current bar to reach _time provided
bars_back_to_time(bars_back)
from bars_back to time
Parameters:
bars_back
Returns: int | using same logic as this will return the
time of the bar = to the bar that corresponds to bars_back
index_time(index)
bar_index to UNIX time
Parameters:
index : (int)
Returns: int time | time in unix that corrresponds to the bar_index
to_utc(time_or_index, timezone, format)
method to use with a time or bar_index variable that will detect if it is an index or unix time
and convert it to a printable string
Parameters:
time_or_index : (int) required) | time in unix or bar_index
timezone : (int) required) | utc offset to be appled to output
format : (string) | default - "yyyy-MM-dd'T'HH:mm:ssZ") | the format for the time, provided string is
default one from str.format_time()
Returns: string | time formatted string
GET(line)
Gets the location paramaters of a Line
Parameters:
line : (line)
Returns: tuple
GET(box)
Gets the location paramaters of a Box
Parameters:
box : (box)
Returns: tuple
GET(label)
Gets the location paramaters and text of a Label
Parameters:
label : (label)
Returns: tuple
GET(linefill)
Gets line 1 and 2 from a Linefill
Parameters:
linefill : (linefill)
Returns: tuple
Format(line, timezone)
converts Unix time in time or index params to formatted time
and returns a tuple of the params as string with the time/index params formatted
Parameters:
line : (line) | required
timezone : (int) | default - na
Returns: tuple
Line(x1, y1, x2, y2, extend, color, style, width)
similar to line.new() with the exception
of not needing to include y2 for a flat line, y1 defaults to close,
and it doesnt require xloc.bar_time or xloc.bar_index, if no x1
Parameters:
x1 : (int) default - time
y1 : (float) default - close
x2 : (int) default - last_bar_time/last_bar_index | not required for line that ends on current bar
y2 : (float) default - y1 | not required for flat line
extend : (string) default - extend.none | extend.left, extend.right, extend.both
color : (color) default - chart.fg_color
style : (string) default - line.style_solid | line.style_dotted, line.style_dashed,
line.style_arrow_both, line.style_arrow_left, line.style_arrow_right
width
Returns: line
Box(left, top, right, bottom, extend, border_color, bgcolor, text_color, border_width, border_style, txt, text_halign, text_valign, text_size, text_wrap)
similar to box.new() but only requires top and bottom to create box,
auto detects if it is bar_index or time used in the (left) arg. xloc.bar_time and xloc.bar_index are not used
args are ordered by purpose | position -> colors -> styling -> text options
Parameters:
left : (int) default - time
top : (float) required
right : (int) default - last_bar_time/last_bar_index | will default to current bar index or time
depending on (left) arg
bottom : (float) required
extend : (string) default - extend.none | extend.left, extend.right, extend.both
border_color : (color) default - chart.fg_color
bgcolor : (color) default - color.new(chart.fg_color,75)
text_color : (color) default - chart.bg_color
border_width : (int) default - 1
border_style : (string) default - line.style_solid | line.style_dotted, line.style_dashed,
txt : (string) default - ''
text_halign : (string) default - text.align_center | text.align_left, text.align_right
text_valign : (string) default - text.align_center | text.align_top, text.align_bottom
text_size : (string) default - size.normal | size.tiny, size.small, size.large, size.huge
text_wrap : (string) default - text.wrap_auto | text.wrap_none
Returns: box
Label(x, y, txt, yloc, color, textcolor, style, size, textalign, text_font_family, tooltip)
similar to label.new() but only requires no args to create label,
auto detects if it is bar_index or time used in the (x) arg. xloc.bar_time and xloc.bar_index are not used
args are ordered by purpose | position -> colors -> styling -> text options
Parameters:
x : (int) default - time
y : (float) default - high or low | depending on bar direction
txt : (string) default - ''
yloc : (string) default - yloc.price | yloc.price, yloc.abovebar, yloc.belowbar
color : (color) default - chart.fg_color
textcolor : (color) default - chart.bg_color
style : (string) default - label.style_label_down | label.style_none
label.style_xcross,label.style_cross,label.style_triangleup,label.style_triangledown
label.style_flag, label.style_circle, label.style_arrowup, label.style_arrowdown,
label.style_label_up, label.style_label_down, label.style_label_left, label.style_label_right,
label.style_label_lower_left, label.style_label_lower_right, label.style_label_upper_left,
label.style_label_upper_right, label.style_label_center, label.style_square,
label.style_diamond
size : (string) default - size.normal | size.tiny, size.small, size.large, size.huge
textalign : (string) default - text.align_center | text.align_left, text.align_right
text_font_family : (string) default - font.family_default | font.family_monospace
tooltip : (string) default - na
Returns: label