OPEN-SOURCE SCRIPT
Updated Liquidity Indicator
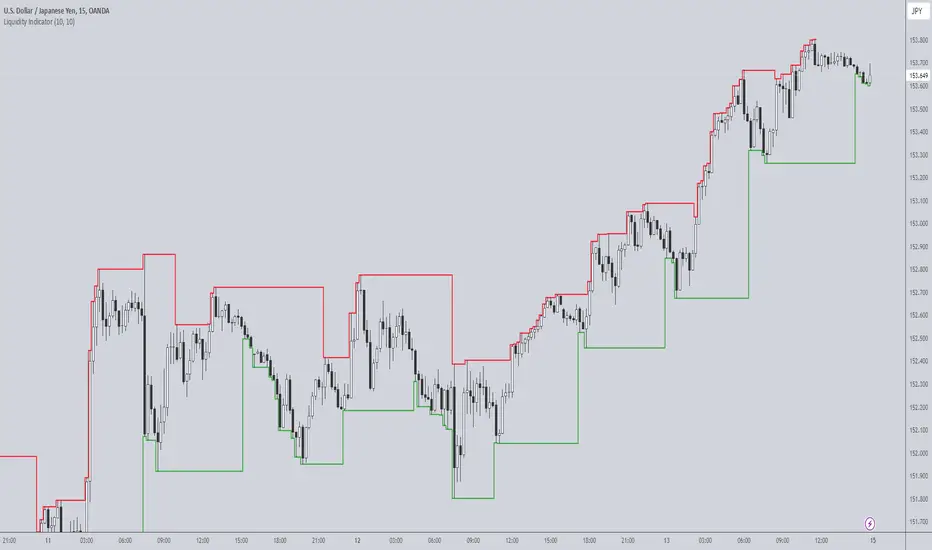
The Liquidity Indicator helps identify key price levels where liquidity may be concentrated by highlighting local highs and local lows on the chart. These levels are calculated using a lookback period to determine the highest and lowest points in the recent price action.
Local Highs: Displayed as red lines, these indicate recent peaks where price has experienced rejection or a possible reversal point.
Local Lows: Displayed as green lines, these represent recent troughs where price may find support or experience a bounce.
This indicator is useful for spotting potential areas of interest for price reversal or continuation, as high liquidity zones may lead to more significant price movements.
Key Features:
Adjustable lookback period to define the scope for identifying local highs and lows.
Continuous plotting without any time restrictions, providing real-time insights into liquidity conditions.
Alerts available for when a local high or local low is detected, enabling timely market analysis.
Use Case:
This indicator can be used in conjunction with other technical analysis tools or strategies to help identify significant price levels where liquidity could impact price action. It is suitable for both intraday and swing traders looking for key price zones where potential reversals or continuations might occur.
Release Notes
The ability to create separate lookback periods for the upper and lower liquidity lines has been added.Release Notes
The ability to create separate lookback periods for the upper and lower liquidity lines has been added.Open-source script
In true TradingView spirit, the creator of this script has made it open-source, so that traders can review and verify its functionality. Kudos to the author! While you can use it for free, remember that republishing the code is subject to our House Rules.
Disclaimer
The information and publications are not meant to be, and do not constitute, financial, investment, trading, or other types of advice or recommendations supplied or endorsed by TradingView. Read more in the Terms of Use.
Open-source script
In true TradingView spirit, the creator of this script has made it open-source, so that traders can review and verify its functionality. Kudos to the author! While you can use it for free, remember that republishing the code is subject to our House Rules.
Disclaimer
The information and publications are not meant to be, and do not constitute, financial, investment, trading, or other types of advice or recommendations supplied or endorsed by TradingView. Read more in the Terms of Use.