OPEN-SOURCE SCRIPT
Trident Finder
Introduction to the Trident Finder
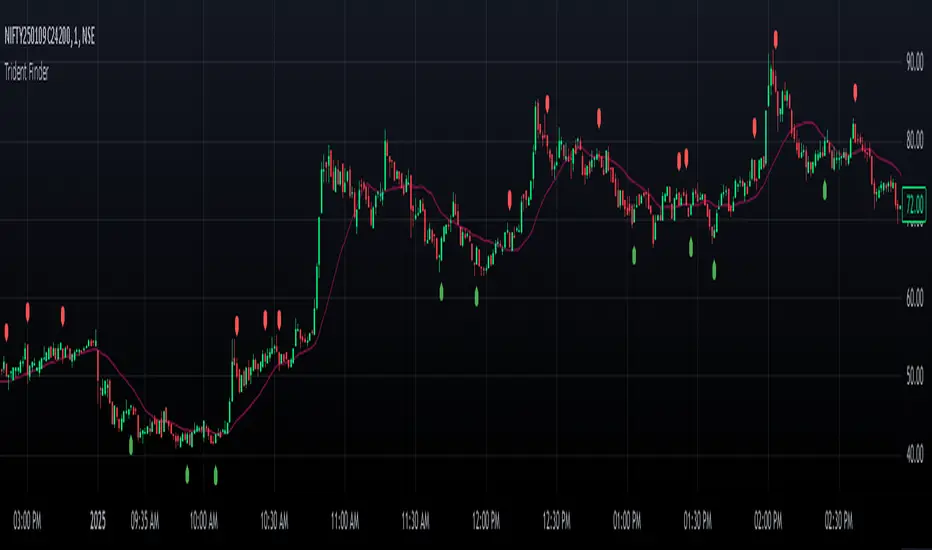
The Trident Finder is a Pine Script indicator that identifies unique bullish and bearish patterns called Tridents. These patterns are based on specific relationships between consecutive candles, combined with a simple moving average (SMA) filter for added precision. By spotting these patterns, traders can potentially identify high-probability reversal points or trend continuations.
Core Logic
The indicator identifies two patterns:
Bullish Trident
A bullish Trident forms when:
Candle[2] (two candles back) has its High-Low range entirely above Candle[1] (the preceding candle).
Candle[0] (the current candle) has its Open-High-Low-Close (OHLC) above the Low of Candle[1].
Candle[0] closes higher than it opens and higher than Candle[1]’s close.
Candle[0] closes below the SMA, indicating a potential upward breakout against the trend.
Bearish Trident
A bearish Trident forms when:
Candle[2] has its High-Low range entirely below Candle[1].
Candle[0] has its OHLC below the High of Candle[1].
Candle[0] closes lower than it opens and lower than Candle[1]’s close.
Candle[0] closes above the SMA, indicating a potential downward breakout against the trend.
Visual Representation
Bullish Tridents are marked with green "Up" labels below the candle.
Bearish Tridents are marked with red "Down" labels above the candle.
The SMA is plotted as a maroon line to serve as a filter for the Trident patterns.
Open-source script
In true TradingView spirit, the creator of this script has made it open-source, so that traders can review and verify its functionality. Kudos to the author! While you can use it for free, remember that republishing the code is subject to our House Rules.
Disclaimer
The information and publications are not meant to be, and do not constitute, financial, investment, trading, or other types of advice or recommendations supplied or endorsed by TradingView. Read more in the Terms of Use.