OPEN-SOURCE SCRIPT
Updated Ultra Moving Average
The Ultra Moving Average is a versatile technical indicator that combines various types of moving averages to analyze trends, providing multi-timeframe insights for traders. It offers four customizable moving averages and a trend strength table for enhanced decision-making.
Introduction
The Ultra Moving Average indicator is a powerful tool designed to help traders track market trends by offering a combination of four distinct moving averages. With flexible customization options, users can apply different types of moving averages like SMA, EMA, TEMA, and many more, across various timeframes. Additionally, it provides trend strength analysis through an intuitive visual table, helping traders quickly identify market conditions.
Detailed Description
.........
- Moving Averages
Each of the four moving averages is independently configurable. You can select the timeframe, type, length, color, and width to match your trading strategy.
The types of moving averages range from traditional ones like the Simple Moving Average (SMA) to advanced ones like the Double Expotential Moving Average (DEMA) or the Triple Exponential Moving Average (TEMA) or the Recursive Moving Average (RMA) or the Weigthend Moving Average (WMA) or the Volume Weigthend Moving Average (VWMA) or Hull Moving Average (HMA).
Very Special ones are the Triple Weigthend Moving Average (TWMA) wich created RedKTrader.
I created the Multi Weigthend Moving Average (MWMA) wich is a simple signal line to the TWMA.
..... - Trend Visualization
The indicator uses color-coding to visually represent whether the price is in an uptrend or downtrend. Bullish trends are highlighted in one color, while bearish trends appear in another, making it easy to interpret.
..... - Trend Strength Table
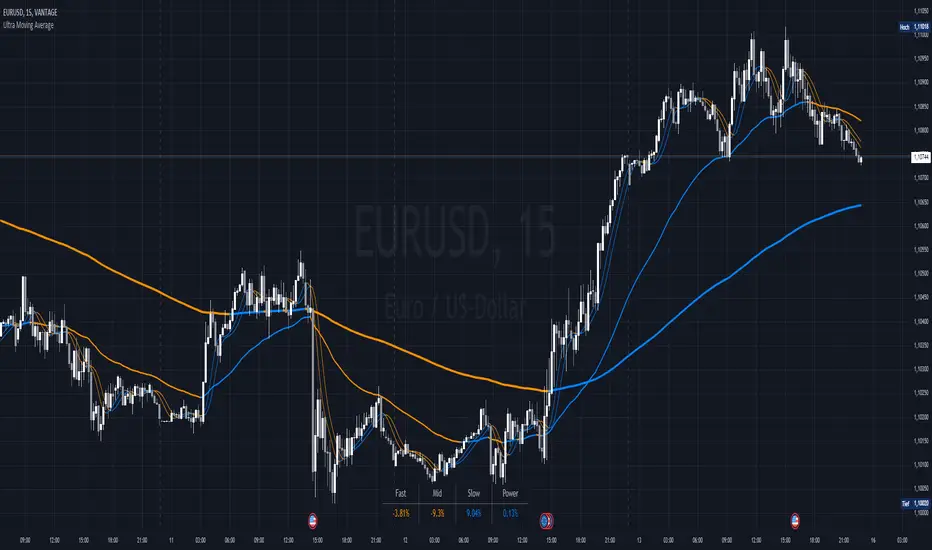
One of the unique features of the Ultra Moving Average is the trend strength table at the bottom of the chart. This table breaks down the strength of the fast, mid, and slow moving averages, displaying them as percentages. It also shows the overall "trend power," which helps assess how strong or weak the current trend is.
You have the option to calculate trends using live data or the previous bar's data, offering flexibility in how the indicator reacts to market changes. This can help traders make more responsive decisions based on real-time trends.
The table displays trend strength across three timeframes Fast, Mid, and Slow by calculating the percentage difference between the price and each of the moving averages (MA1, MA3, MA4).
The Power row shows the average of these percentages, representing overall trend strength.
The percentages are calculated relative to their maximum values in history (limited by TradingView subscription), providing insight into the trend's strength for each timeframe.
.........
Overall, the Ultra Moving Average indicator is a comprehensive tool that combines multiple moving average types and advanced trend analysis, helping traders identify market direction and strength at a glance. With its intuitive visualization and flexible settings, it's suited for both beginner and experienced traders.
Special Thanks
I use the TWMA-Function created from RedKTrader to smooth the values.
Special thanks to him for creating and sharing this function!
Release Notes
update (added Trend Flow Line (TFL) and Symetric Weightend Moving Average (SWMA))Open-source script
In true TradingView spirit, the creator of this script has made it open-source, so that traders can review and verify its functionality. Kudos to the author! While you can use it for free, remember that republishing the code is subject to our House Rules.
Disclaimer
The information and publications are not meant to be, and do not constitute, financial, investment, trading, or other types of advice or recommendations supplied or endorsed by TradingView. Read more in the Terms of Use.
Open-source script
In true TradingView spirit, the creator of this script has made it open-source, so that traders can review and verify its functionality. Kudos to the author! While you can use it for free, remember that republishing the code is subject to our House Rules.
Disclaimer
The information and publications are not meant to be, and do not constitute, financial, investment, trading, or other types of advice or recommendations supplied or endorsed by TradingView. Read more in the Terms of Use.