OPEN-SOURCE SCRIPT
Stage Market Analyzer
Stage Market Analyzer – User Guide
Overview:
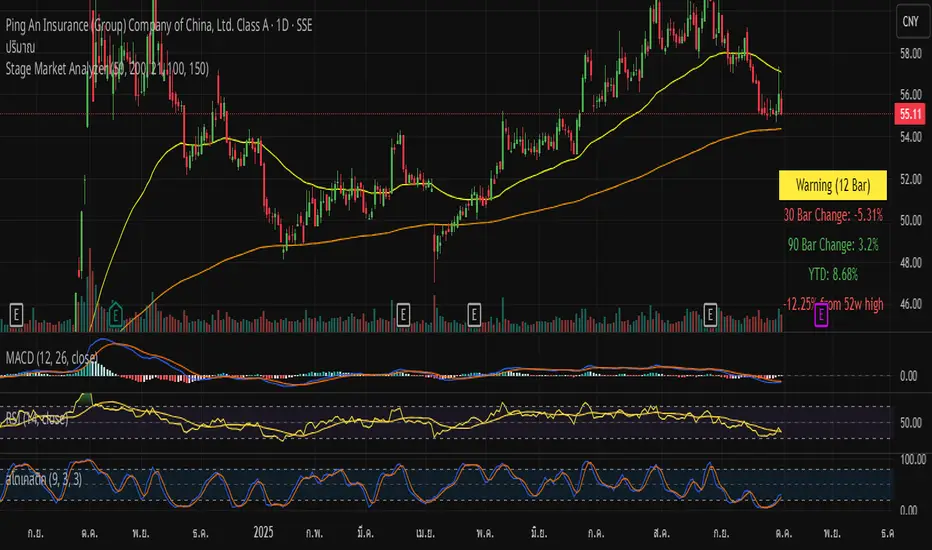
The “Stage Market Analyzer” indicator is a comprehensive market analysis tool that identifies the current market phase (6 stages) using multiple EMAs (Exponential Moving Averages) and provides key performance metrics including 52-week high, YTD change, and recent price changes. This indicator is displayed on the chart with a visual table and plotted EMA lines for easy trend analysis.
Market Stages
-The indicator classifies the market into six stages based on the position of price relative to the fast and slow EMAs:
Recovery:
-Price above the fast EMA, but below the slow EMA.
-Slow EMA is above the fast EMA.
-ndicates a market recovering from a downtrend.
Accumulation:
-Price above both EMAs, slow EMA above fast EMA.
-Suggests accumulation phase, usually after a downtrend.
Bull Market:
-Price above both EMAs, fast EMA above slow EMA.
-Represents strong uptrend.
Warning:
-Price below both EMAs, fast EMA above slow EMA.
-Signals caution; potential weakening trend.
Distribution:
-Price below fast EMA, slow EMA below fast EMA.
-Market may be topping or preparing to reverse.
Bear Market:
-Price below both EMAs, slow EMA above fast EMA.
-Strong downtrend confirmed.
The indicator counts consecutive bars within the same stage and displays this as “Stage Name (X Bar)” in the table.
EMA Settings
-Fast EMA: Default 50 bars.
-Slow EMA: Default 200 bars.
Additional EMAs: EMA1 (21), EMA2 (100), EMA3 (150) – optional display.
Users can customize all EMA lengths and choose which EMAs to display.
The plotted EMAs help visualize trends, crossovers, and market momentum.
Performance Metrics
30-Bar & 90-Bar Price Change:
Displays the percentage change over the last 30 or 90 bars.
Positive change in green, negative in red.
YTD Change (Year-to-Date):
-Calculated from the first trading bar of the current year to current price.
-Reflects overall market performance for the current year.
52-Week High:
-Shows the percentage difference between current price and the highest price over the last 52 weeks.
-Adjusts automatically for the chart timeframe:
Daily: last 252 bars
Weekly: last 52 bars
Monthly: last 12 bars
Intraday: calculated based on bars per day × 252 trading days
Positive deviation is shown in green, negative in red.
Note: For non-daily charts, the calculation approximates a “year” based on available bars.
Table Display
Located at the bottom-right of the chart.
Columns:
Current Market Stage (with consecutive bar count)
30-Bar Change
90-Bar Change
YTD Change
52-Week High (optional)
Background colors indicate the stage for quick visual reference.
How to Use
Add the indicator to your chart.
Adjust EMAs to match your trading strategy.
Observe the table to understand:
Current market phase
Short-term and long-term performance metrics
Trend direction using plotted EMAs
Use the stage information together with other analysis (support/resistance, volume, etc.) to make informed trading decisions.
Notes & Recommendations
The indicator works best on daily charts for accurate 52-week high and YTD calculations.
For crypto or non-standard trading calendars, be aware that intraday data may approximate the “year” differently.
EMAs are customizable – experiment with different lengths to fit your preferred timeframe or trading style.
Overview:
The “Stage Market Analyzer” indicator is a comprehensive market analysis tool that identifies the current market phase (6 stages) using multiple EMAs (Exponential Moving Averages) and provides key performance metrics including 52-week high, YTD change, and recent price changes. This indicator is displayed on the chart with a visual table and plotted EMA lines for easy trend analysis.
Market Stages
-The indicator classifies the market into six stages based on the position of price relative to the fast and slow EMAs:
Recovery:
-Price above the fast EMA, but below the slow EMA.
-Slow EMA is above the fast EMA.
-ndicates a market recovering from a downtrend.
Accumulation:
-Price above both EMAs, slow EMA above fast EMA.
-Suggests accumulation phase, usually after a downtrend.
Bull Market:
-Price above both EMAs, fast EMA above slow EMA.
-Represents strong uptrend.
Warning:
-Price below both EMAs, fast EMA above slow EMA.
-Signals caution; potential weakening trend.
Distribution:
-Price below fast EMA, slow EMA below fast EMA.
-Market may be topping or preparing to reverse.
Bear Market:
-Price below both EMAs, slow EMA above fast EMA.
-Strong downtrend confirmed.
The indicator counts consecutive bars within the same stage and displays this as “Stage Name (X Bar)” in the table.
EMA Settings
-Fast EMA: Default 50 bars.
-Slow EMA: Default 200 bars.
Additional EMAs: EMA1 (21), EMA2 (100), EMA3 (150) – optional display.
Users can customize all EMA lengths and choose which EMAs to display.
The plotted EMAs help visualize trends, crossovers, and market momentum.
Performance Metrics
30-Bar & 90-Bar Price Change:
Displays the percentage change over the last 30 or 90 bars.
Positive change in green, negative in red.
YTD Change (Year-to-Date):
-Calculated from the first trading bar of the current year to current price.
-Reflects overall market performance for the current year.
52-Week High:
-Shows the percentage difference between current price and the highest price over the last 52 weeks.
-Adjusts automatically for the chart timeframe:
Daily: last 252 bars
Weekly: last 52 bars
Monthly: last 12 bars
Intraday: calculated based on bars per day × 252 trading days
Positive deviation is shown in green, negative in red.
Note: For non-daily charts, the calculation approximates a “year” based on available bars.
Table Display
Located at the bottom-right of the chart.
Columns:
Current Market Stage (with consecutive bar count)
30-Bar Change
90-Bar Change
YTD Change
52-Week High (optional)
Background colors indicate the stage for quick visual reference.
How to Use
Add the indicator to your chart.
Adjust EMAs to match your trading strategy.
Observe the table to understand:
Current market phase
Short-term and long-term performance metrics
Trend direction using plotted EMAs
Use the stage information together with other analysis (support/resistance, volume, etc.) to make informed trading decisions.
Notes & Recommendations
The indicator works best on daily charts for accurate 52-week high and YTD calculations.
For crypto or non-standard trading calendars, be aware that intraday data may approximate the “year” differently.
EMAs are customizable – experiment with different lengths to fit your preferred timeframe or trading style.
Open-source script
In true TradingView spirit, the creator of this script has made it open-source, so that traders can review and verify its functionality. Kudos to the author! While you can use it for free, remember that republishing the code is subject to our House Rules.
Disclaimer
The information and publications are not meant to be, and do not constitute, financial, investment, trading, or other types of advice or recommendations supplied or endorsed by TradingView. Read more in the Terms of Use.