Bullish/Bearish Phases
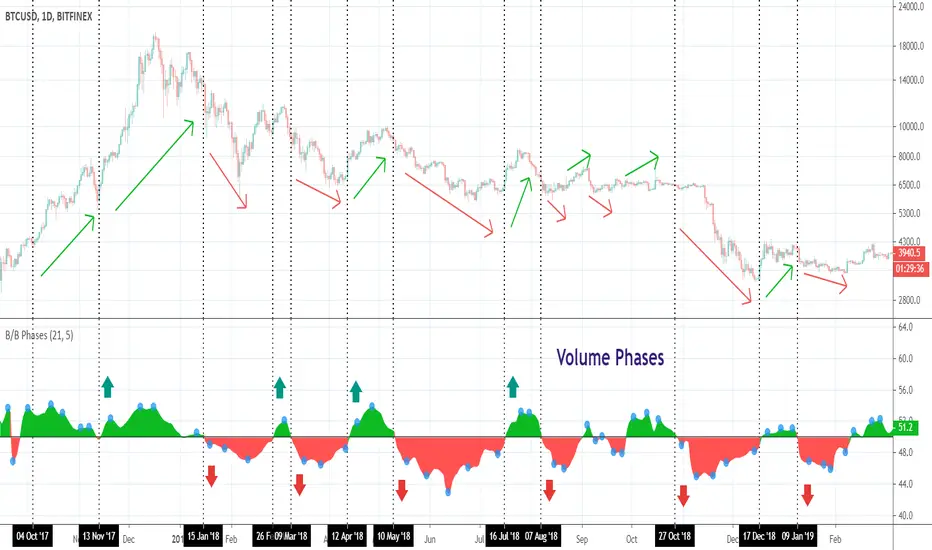
This indicator shows you bullish or bearish dominance during the specified period and is based on the volume calculations. Why? Volume acts as an excellent confirmation tool of the price movements and is used to determine if an instrument is gaining or losing momentum.
Bullish/Bearish Phases can be used to find out divergences with the price. It will work on ANY instrument that has available volume data.
NOTE: The blue circles appear on the local peaks.
I attached some screenshots to show you how it works with other instruments.
Happy Trading!
- Changed styling
- Added smoothing with Jurik Moving Average
- Update
Invite-only script
Only users approved by the author can access this script. You'll need to request and get permission to use it. This is typically granted after payment. For more details, follow the author's instructions below or contact everget directly.
TradingView does NOT recommend paying for or using a script unless you fully trust its author and understand how it works. You may also find free, open-source alternatives in our community scripts.
Author's instructions
🆓 List of my FREE indicators: bit.ly/2S7EPuN
💰 List of my PREMIUM indicators: bit.ly/33MA81f
Join Bybit and get up to $6,045 in bonuses!
bybit.com/invite?ref=56ZLQ0Z
Disclaimer
Invite-only script
Only users approved by the author can access this script. You'll need to request and get permission to use it. This is typically granted after payment. For more details, follow the author's instructions below or contact everget directly.
TradingView does NOT recommend paying for or using a script unless you fully trust its author and understand how it works. You may also find free, open-source alternatives in our community scripts.
Author's instructions
🆓 List of my FREE indicators: bit.ly/2S7EPuN
💰 List of my PREMIUM indicators: bit.ly/33MA81f
Join Bybit and get up to $6,045 in bonuses!
bybit.com/invite?ref=56ZLQ0Z