PROTECTED SOURCE SCRIPT
Updated Armi Goldman V1.7 Copernicus
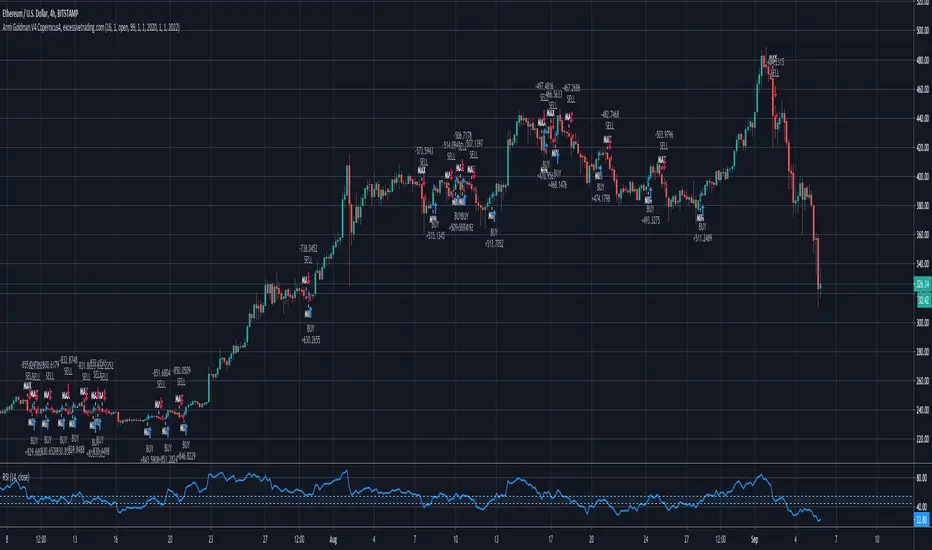
Script uses an EMA (Exponential Moving Average) as an indicator. When the price crosses (breakout/breakdown) the EMA, the trigger is activated. Script does the breakout and breakdown calculations. It considers one candle close above or below the EMA.
It is used only in trending markets like bullish trends and/or bearish trends and never in flat. It can get very bad results so pay attention!
Feel free to test it and add comments.
I am open to answer any questions.
I would like to know what you think and how can we improve this strategy.
Thank you & enjoy!
Release Notes
Changed the chart so it can be clear of other drawingsChanged the code so it writes TOP and BOT (form BOTTOM)
Changed the default minimum years for backtest
Release Notes
Changed the chart so it is clean and does not show any other lines or technical analysis.Changed the text plotted to "MAX" and "MIN" (from Maximum and Minimum)
Changed the minval for backtest year back to 1970
Release Notes
Added Stop Loss option with percentageRelease Notes
Updated to Version4 of Pinescript so you can use alerts from this strategy. Enjoy!Release Notes
- changed the EMA to a regular one so it can reflect the reality
Protected script
This script is published as closed-source. However, you can use it freely and without any limitations – learn more here.
To define trading is to limit trading. Goldman Armi
excessivetrading.com t.me/excessivetraders
excessivetrading.com t.me/excessivetraders
Disclaimer
The information and publications are not meant to be, and do not constitute, financial, investment, trading, or other types of advice or recommendations supplied or endorsed by TradingView. Read more in the Terms of Use.