PROTECTED SOURCE SCRIPT
The Forex Stop Loss Calculator
NOTE: I am NOT a professional trader. I DO NOT provide investment advice. This content and the data provided in the indicator is based on my live and simulated, personal observations and is ONLY intended for educational purposes. YOU are responsible for ALL your trading decisions and ALL subsequent tax ramifications. Past performance DOES NOT guarantee future results.
“The Forex Stop Loss Calculator” ONLY displays numbers, NOT lines or a histogram etc. Why? It’s simple! All that other stuff is just clutter on your screen. By displaying ONLY numbers, you can tighten the vertical height of this indicator down to almost nothing. That saves precious real estate on your chart.
Here is what the 8 numbers displayed in “The Forex Stop Loss Calculator” can DO FOR YOU:
Buy/Long Position Stop Losses:
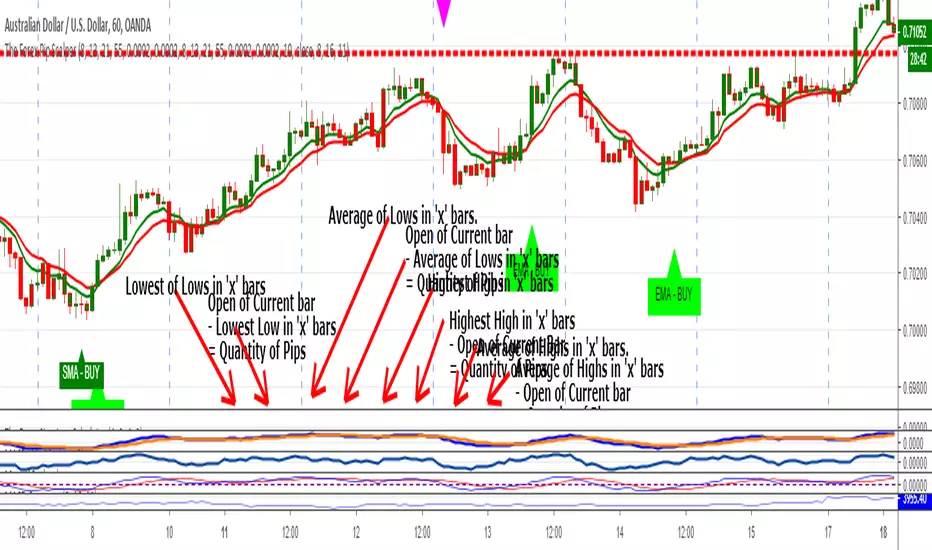
#1: This Green Number helps locate a potential Stop Loss PRICE LOCATION for your BUY position based on the LOWEST LOW within a variable number of bars back. You can set that variable quantity to any number of bars desired. This quantity INcludes the Current Bar.
#2: This Green Number stops you from having to do any math. It subtracts the Price Location listed in the previous Green Number from the OPEN Price of the Current Bar and yields the Quantity of Pips you might risk between those two prices. Here is why that is important. Let’s say that you do not take trades that are above a certain pip/risk number. With “The Forex Stop Loss Calculator” you DO NOT have to bring up any extra tools or do any quick calculations. That’s all a waste of time. With this indicator you can determine at a glance if the current set up is within your personal trading rules. For example, if this listing was .00072 (with a PRECISION setting of 5 decimal points), that would indicate a Stop Loss of 7.2 pips. If that number is above your normal risk tolerance you move onto the next pair.
#3: This Blue Number provides a slightly DIFFERENT way to determine a Stop Loss for a BUY position. It displays the AVERAGE LOW Price Location within a variable number of bars back. You can set that variable quantity from 1-25 bars. This quantity EXcludes the Current Bar.
#4: This Blue Number stops you from having to do any math. It subtracts the AVERAGE Price Location listed in the previous Blue Number from the OPEN Price of the Current Bar and yields the Quantity of Pips you might risk between those two prices. For example, if this listing was .031 (with a PRECISION setting of 3 decimal points), that would indicate a Stop Loss of 3.1 pips. This obviously saves time as I mentioned in #2 above.
Sell/Short Position Stop Losses:
#5: This Red Number helps locate a potential Stop Loss PRICE LOCATION for your SELL position based on the HIGHEST HIGH within a variable number of bars back. You can set that variable quantity to any number of bars desired. This quantity INcludes the Current Bar.
#6: This Red Number stops you from having to do any math. It subtracts the OPEN Price of the Current Bar from the Price Location listed in the previous Red Number and yields the Quantity of Pips you might risk between those two prices. For example, if this listing was .00065 (with a PRECISION setting of 5 decimal points), that would indicate a Stop Loss of 6.5 pips. Here again, this saves time as I mentioned in #2 above.
#7: This Blue Number provides a slightly DIFFERENT way to determine a Stop Loss for a SELL position. It displays the AVERAGE HIGH Price Location within a variable number of bars back. You can set that variable quantity from 1-25 bars. This quantity EXcludes the Current Bar.
#8: This Blue Number stops you from having to do any math. It subtracts the OPEN Price of the Current Bar from the AVERAGE Price Location listed in the previous Blue Number and yields the Quantity of Pips you might risk between those two prices. For example, if this listing was .088 (with a PRECISION setting of 3 decimal points), that would indicate a Stop Loss of 8.8 pips. As I mentioned in #2 above, this obviously save a lot of time.
IMPORTANT: Some Forex pairs are displayed with 3 decimal points. Others are displayed with 5 decimal points. The default setting for “The Forex Stop Loss Calculator” is 3 decimal points. However, that can be EASILY changed. Just click on the ‘SETTINGS/GEAR’ icon which is the second one to the right of the name of the indicator. At the BOTTOM of the ‘STYLE’ tab, change the ‘PRECISION’ setting back and forth from 3 to 5 as necessary. Hit ‘OK’ and you are good to go.
OR (if you left the Precision setting at 5) once you land on a chart, immediately make a quick mental note as to the decimal point quantity in the price scale of that chart. If it is a 3 decimal point pair, just disregard the LAST TWO numbers in the display of the indicator. In other words, a display of .08967 for a 3 decimal point pair would indicate a Stop Loss of 8.9 pips.
NOTE: If you install the indicator and the calculated numbers are not displayed, that’s an EASY fix. Simply RIGHT click on any white space in the chart. Near the bottom of the pop up screen, select ‘SETTINGS’. Next, select the ‘BACKGROUND’ tab. On that tab, locate ‘INDICATOR VALUES’. Put a check in that box, click ‘OK’ and you’re done. The numbers defined by the indicator should now be displayed to the right of its name.
If you would like a Word Document version of this information, just private message me.
Full Speed ahead. Go get ‘em!!!
The Trading Guy
“The Forex Stop Loss Calculator” ONLY displays numbers, NOT lines or a histogram etc. Why? It’s simple! All that other stuff is just clutter on your screen. By displaying ONLY numbers, you can tighten the vertical height of this indicator down to almost nothing. That saves precious real estate on your chart.
Here is what the 8 numbers displayed in “The Forex Stop Loss Calculator” can DO FOR YOU:
Buy/Long Position Stop Losses:
#1: This Green Number helps locate a potential Stop Loss PRICE LOCATION for your BUY position based on the LOWEST LOW within a variable number of bars back. You can set that variable quantity to any number of bars desired. This quantity INcludes the Current Bar.
#2: This Green Number stops you from having to do any math. It subtracts the Price Location listed in the previous Green Number from the OPEN Price of the Current Bar and yields the Quantity of Pips you might risk between those two prices. Here is why that is important. Let’s say that you do not take trades that are above a certain pip/risk number. With “The Forex Stop Loss Calculator” you DO NOT have to bring up any extra tools or do any quick calculations. That’s all a waste of time. With this indicator you can determine at a glance if the current set up is within your personal trading rules. For example, if this listing was .00072 (with a PRECISION setting of 5 decimal points), that would indicate a Stop Loss of 7.2 pips. If that number is above your normal risk tolerance you move onto the next pair.
#3: This Blue Number provides a slightly DIFFERENT way to determine a Stop Loss for a BUY position. It displays the AVERAGE LOW Price Location within a variable number of bars back. You can set that variable quantity from 1-25 bars. This quantity EXcludes the Current Bar.
#4: This Blue Number stops you from having to do any math. It subtracts the AVERAGE Price Location listed in the previous Blue Number from the OPEN Price of the Current Bar and yields the Quantity of Pips you might risk between those two prices. For example, if this listing was .031 (with a PRECISION setting of 3 decimal points), that would indicate a Stop Loss of 3.1 pips. This obviously saves time as I mentioned in #2 above.
Sell/Short Position Stop Losses:
#5: This Red Number helps locate a potential Stop Loss PRICE LOCATION for your SELL position based on the HIGHEST HIGH within a variable number of bars back. You can set that variable quantity to any number of bars desired. This quantity INcludes the Current Bar.
#6: This Red Number stops you from having to do any math. It subtracts the OPEN Price of the Current Bar from the Price Location listed in the previous Red Number and yields the Quantity of Pips you might risk between those two prices. For example, if this listing was .00065 (with a PRECISION setting of 5 decimal points), that would indicate a Stop Loss of 6.5 pips. Here again, this saves time as I mentioned in #2 above.
#7: This Blue Number provides a slightly DIFFERENT way to determine a Stop Loss for a SELL position. It displays the AVERAGE HIGH Price Location within a variable number of bars back. You can set that variable quantity from 1-25 bars. This quantity EXcludes the Current Bar.
#8: This Blue Number stops you from having to do any math. It subtracts the OPEN Price of the Current Bar from the AVERAGE Price Location listed in the previous Blue Number and yields the Quantity of Pips you might risk between those two prices. For example, if this listing was .088 (with a PRECISION setting of 3 decimal points), that would indicate a Stop Loss of 8.8 pips. As I mentioned in #2 above, this obviously save a lot of time.
IMPORTANT: Some Forex pairs are displayed with 3 decimal points. Others are displayed with 5 decimal points. The default setting for “The Forex Stop Loss Calculator” is 3 decimal points. However, that can be EASILY changed. Just click on the ‘SETTINGS/GEAR’ icon which is the second one to the right of the name of the indicator. At the BOTTOM of the ‘STYLE’ tab, change the ‘PRECISION’ setting back and forth from 3 to 5 as necessary. Hit ‘OK’ and you are good to go.
OR (if you left the Precision setting at 5) once you land on a chart, immediately make a quick mental note as to the decimal point quantity in the price scale of that chart. If it is a 3 decimal point pair, just disregard the LAST TWO numbers in the display of the indicator. In other words, a display of .08967 for a 3 decimal point pair would indicate a Stop Loss of 8.9 pips.
NOTE: If you install the indicator and the calculated numbers are not displayed, that’s an EASY fix. Simply RIGHT click on any white space in the chart. Near the bottom of the pop up screen, select ‘SETTINGS’. Next, select the ‘BACKGROUND’ tab. On that tab, locate ‘INDICATOR VALUES’. Put a check in that box, click ‘OK’ and you’re done. The numbers defined by the indicator should now be displayed to the right of its name.
If you would like a Word Document version of this information, just private message me.
Full Speed ahead. Go get ‘em!!!
The Trading Guy
Protected script
This script is published as closed-source. However, you can use it freely and without any limitations – learn more here.
Disclaimer
The information and publications are not meant to be, and do not constitute, financial, investment, trading, or other types of advice or recommendations supplied or endorsed by TradingView. Read more in the Terms of Use.