Expansion Contraction Indicator
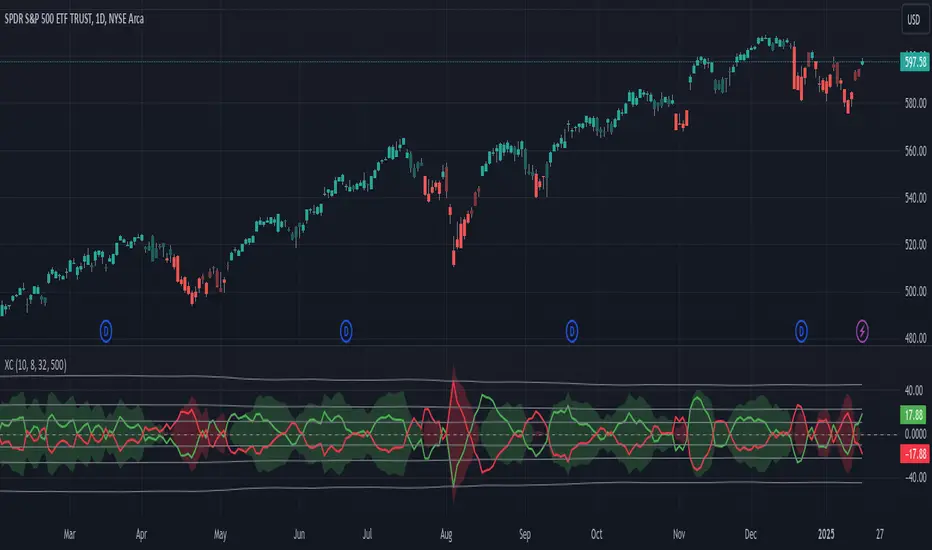
Expansion Contraction measures the speed at which price moves through two moving averages, a 10 period SMA of the high and an 8 period SMA of the low (Moving Average Channel). When the Positive (green) line crosses above the zero line and the cloud is green, we are in a strong uptrend and a buy signal can be taken. When the Negative (red) line crosses above the zero line and the cloud is red, we are in a strong downtrend and a sell signal can be taken.
Standard deviation (gray) lines are added to measure the strength of the trend and support and resistance areas. When the short lines go above 1 or 2 standard deviations, it may indicate price may have gotten very high or very low too quickly in the short term. When the cloud goes above 2 standard deviations, it may indicate the overall trend may be getting ready for a reversal.
Formula created by Brian Latta, author of The Book on Trading - The Secret Language of the Markets. Moving Average Channel concept by Jake Bernstein, author of many best-seller books on day-trading, including The Compleat Day Trader, Seasonal Futures Spreads, and more.
Invite-only script
Only users approved by the author can access this script. You'll need to request and get permission to use it. This is typically granted after payment. For more details, follow the author's instructions below or contact TickSurfers directly.
Note that this private, invite-only script has not been reviewed by script moderators, and its compliance with House Rules is undetermined. TradingView does NOT recommend paying for or using a script unless you fully trust its author and understand how it works. You may also find free, open-source alternatives in our community scripts.
Author's instructions
Disclaimer
Invite-only script
Only users approved by the author can access this script. You'll need to request and get permission to use it. This is typically granted after payment. For more details, follow the author's instructions below or contact TickSurfers directly.
Note that this private, invite-only script has not been reviewed by script moderators, and its compliance with House Rules is undetermined. TradingView does NOT recommend paying for or using a script unless you fully trust its author and understand how it works. You may also find free, open-source alternatives in our community scripts.