[PATAlgo] Index Options (v2)
This advanced indicator is engineered to empower traders with real-time insights into market trends and price dynamics. Through sophisticated algorithms and cutting-edge functionalities, it provides a competitive edge, enabling users to stay ahead of market curves and make well-informed trading decisions.
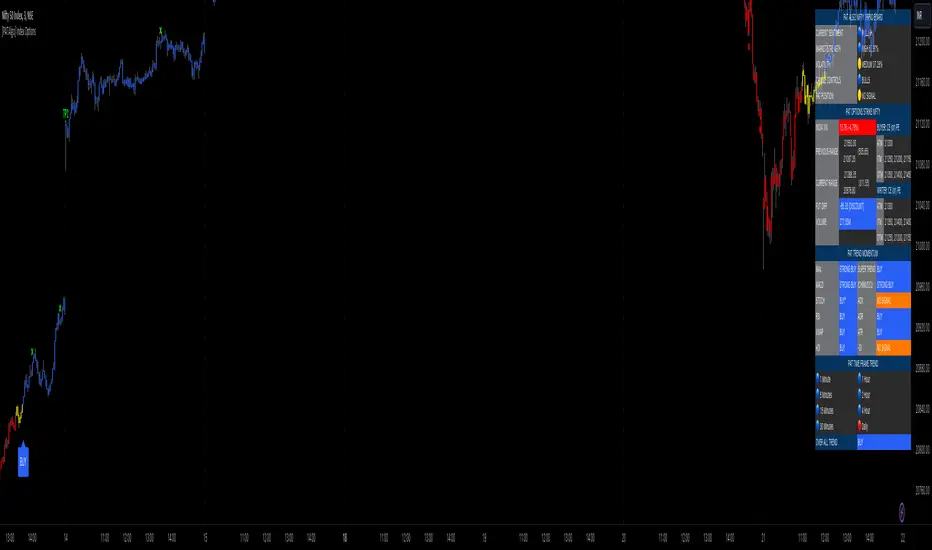
One of the standout features of PATAlgo Index Options is its chart and candle analysis setup, facilitating pattern identification and aiding traders in making prudent decisions. Below, we delve into the core features of this indicator suite, offering a detailed explanation of its functionalities.
1. PAT Signals:
Signal Mode: Tailored to trader styles, accommodating scalpers, swing traders, and positional traders.
Signal Reactivity: Allows customization for signal frequency, with settings ranging from 1.2 to 6.
Signal Strength: Defines signal intensity on a scale from 1 to 10.
2. PAT Trace:
A trend-tracing tool effective across all time frames, particularly beneficial for scalpers and swing traders.
Analyzes historical price data to identify patterns, support/resistance levels, and trend lines.
3. PAT Trends:
An auto-trending indicator based on price action and patterns, offering clarity on market trends and breakouts.
4. PAT Profile:
A powerful volume analysis tool aiding in technical analysis.
Analyzes traded volume at different price levels, identifying support and resistance, tracking market sentiment, and informing trading decisions.
5. PAT S/R:
Auto support and resistance analysis tool, eliminating the need for manual analysis.
Provides traders with key levels for making informed trading decisions.
6. PAT Auto FIB:
Automatically plots Fibonacci retracement levels on a price chart.
Simplifies the identification of potential support and resistance areas based on Fibonacci ratios.
7. PAT Blocks:
Represents significant buying or selling activity on a particular price level.
Identifies price rejections or consolidations, indicating potential imbalances between supply and demand.
8. PAT Zone:
Identifies key support and resistance zones on a price chart.
Indicates areas where buying and selling pressure is concentrated based on historical price action.
Invite-only script
Only users approved by the author can access this script. You'll need to request and get permission to use it. This is typically granted after payment. For more details, follow the author's instructions below or contact PAT_CLUB directly.
Note that this private, invite-only script has not been reviewed by script moderators, and its compliance with House Rules is undetermined. TradingView does NOT recommend paying for or using a script unless you fully trust its author and understand how it works. You may also find free, open-source alternatives in our community scripts.
Author's instructions
Disclaimer
Invite-only script
Only users approved by the author can access this script. You'll need to request and get permission to use it. This is typically granted after payment. For more details, follow the author's instructions below or contact PAT_CLUB directly.
Note that this private, invite-only script has not been reviewed by script moderators, and its compliance with House Rules is undetermined. TradingView does NOT recommend paying for or using a script unless you fully trust its author and understand how it works. You may also find free, open-source alternatives in our community scripts.