Swing elite Trend direction
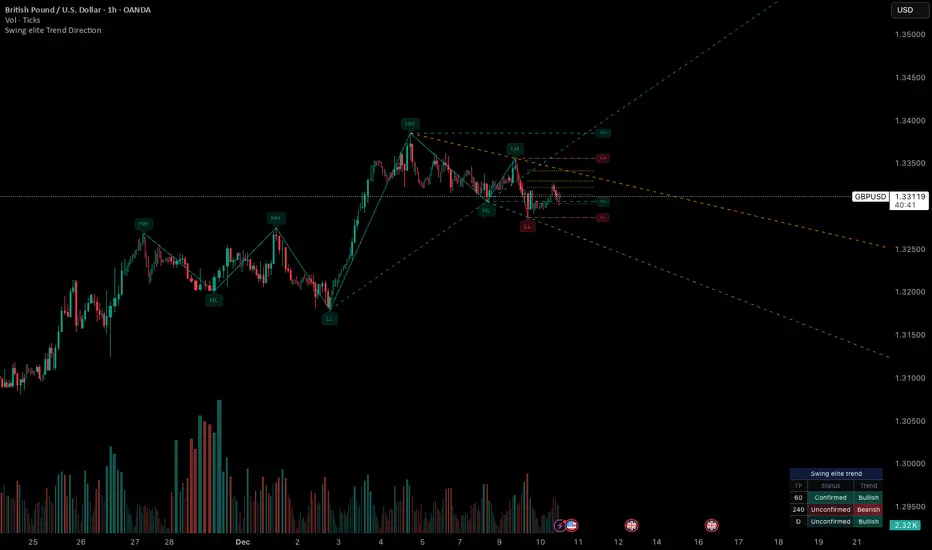
A comprehensive market structure indicator that identifies swing highs/lows, labels them with HH/HL/LH/LL structure, draws dynamic trendlines, and provides multi-timeframe trend analysis.
🔹 FEATURES
Market Structure Analysis
Automatically detects swing highs and swing lows
Labels each pivot with its structure type: HH (Higher High), HL (Higher Low), LH (Lower High), LL (Lower Low)
Color-coded zigzag lines based on confirmed trend direction
Structure Trendlines
Downtrend Line: Connects HH to LH (resistance in bearish structure)
Uptrend Line: Connects LL to HL (support in bullish structure)
Extended projection for potential future price interaction
Swing Trendlines
Connects the last 2 swing highs (resistance trendline)
Connects the last 2 swing lows (support trendline)
Optional extension to project future levels
Break Levels
Horizontal lines at key structure points (HH, HL, LL, LH)
Visual reference for potential breakout/breakdown levels
Customizable colors for bullish and bearish breaks
Fibonacci Retracement
Auto-drawn between the last two pivots
Customizable levels: 0, 0.236, 0.382, 0.5, 0.618, 0.786, 1.0
Individual toggle and color settings for each level
Multi-Timeframe Dashboard
Displays trend status across 3 customizable timeframes
Shows trend direction: Bullish / Bearish / Neutral
Shows confirmation status: Confirmed / Unconfirmed
Color-coded for quick visual analysis
Trend Confirmation Logic (ICT/SMC Concepts)
Bullish Confirmed: HL followed by HH (Higher Low → Higher High pattern)
Bearish Confirmed: LH followed by LL (Lower High → Lower Low pattern)
Unconfirmed: Counter-structure appears (potential reversal signal)
🔹 SETTINGS
Swing Settings
Depth: Lookback period for pivot detection
Display
Toggle zigzag lines, labels, price on labels
Adjust label size and number of visible swings
Zigzag Settings
Line style: Solid, Dashed, Dotted
Thickness and colors for bullish/bearish trends
Swing Trendlines
Toggle high/low trendlines independently
Customizable colors, style, thickness
Option to extend trendlines
Structure Trendlines
Toggle HH→LH and LL→HL lines independently
Customizable colors, style, thickness
Option to extend trendlines
Break Levels
Toggle HH, HL, LL, LH break levels independently
Customizable colors for each level
Fibonacci
Toggle individual fib levels
Customizable colors and line style
Dashboard
Position: Top Left, Top Right, Bottom Left, Bottom Right
Size: Tiny, Small, Normal, Large
3 customizable timeframes
🔹 ALERTS
HH Broken: Price breaks above recent Higher High
HL Broken: Price breaks below recent Higher Low
LL Broken: Price breaks below recent Lower Low
LH Broken: Price breaks above recent Lower High
🔹 USE CASES
✅ Identify market structure and trend direction
✅ Spot potential trend reversals (unconfirmed status)
✅ Find key support/resistance levels
✅ Multi-timeframe trend alignment for trade confirmation
✅ Breakout/breakdown trading with break levels
✅ Fibonacci retracement entries
3 hours ago
Release Notes
Swing elite Trend direction
A comprehensive market structure indicator that identifies swing highs/lows, labels them with HH/HL/LH/LL structure, draws dynamic trendlines, and provides multi-timeframe trend analysis.
🔹 FEATURES
Market Structure Analysis
Automatically detects swing highs and swing lows
Labels each pivot with its structure type: HH (Higher High), HL (Higher Low), LH (Lower High), LL (Lower Low)
Color-coded zigzag lines based on confirmed trend direction
Structure Trendlines
Downtrend Line: Connects HH to LH (resistance in bearish structure)
Uptrend Line: Connects LL to HL (support in bullish structure)
Extended projection for potential future price interaction
Swing Trendlines
Connects the last 2 swing highs (resistance trendline)
Connects the last 2 swing lows (support trendline)
Optional extension to project future levels
Break Levels
Horizontal lines at key structure points (HH, HL, LL, LH)
Visual reference for potential breakout/breakdown levels
Customizable colors for bullish and bearish breaks
Fibonacci Retracement
Auto-drawn between the last two pivots
Customizable levels: 0, 0.236, 0.382, 0.5, 0.618, 0.786, 1.0
Individual toggle and color settings for each level
Multi-Timeframe Dashboard
Displays trend status across 3 customizable timeframes
Shows trend direction: Bullish / Bearish / Neutral
Shows confirmation status: Confirmed / Unconfirmed
Color-coded for quick visual analysis
Trend Confirmation Logic (ICT/SMC Concepts)
Bullish Confirmed: HL followed by HH (Higher Low → Higher High pattern)
Bearish Confirmed: LH followed by LL (Lower High → Lower Low pattern)
Unconfirmed: Counter-structure appears (potential reversal signal)
🔹 SETTINGS
Swing Settings
Depth: Lookback period for pivot detection
Display
Toggle zigzag lines, labels, price on labels
Adjust label size and number of visible swings
Zigzag Settings
Line style: Solid, Dashed, Dotted
Thickness and colors for bullish/bearish trends
Swing Trendlines
Toggle high/low trendlines independently
Customizable colors, style, thickness
Option to extend trendlines
Structure Trendlines
Toggle HH→LH and LL→HL lines independently
Customizable colors, style, thickness
Option to extend trendlines
Break Levels
Toggle HH, HL, LL, LH break levels independently
Customizable colors for each level
Fibonacci
Toggle individual fib levels
Customizable colors and line style
Dashboard
Position: Top Left, Top Right, Bottom Left, Bottom Right
Size: Tiny, Small, Normal, Large
3 customizable timeframes
🔹 ALERTS
HH Broken: Price breaks above recent Higher High
HL Broken: Price breaks below recent Higher Low
LL Broken: Price breaks below recent Lower Low
LH Broken: Price breaks above recent Lower High
🔹 USE CASES
✅ Identify market structure and trend direction
✅ Spot potential trend reversals (unconfirmed status)
✅ Find key support/resistance levels
✅ Multi-timeframe trend alignment for trade confirmation
✅ Breakout/breakdown trading with break levels
✅ Fibonacci retracement entries
3 hours ago
Release Notes
Swing elite Trend direction
A comprehensive market structure indicator that identifies swing highs/lows, labels them with HH/HL/LH/LL structure, draws dynamic trendlines, and provides multi-timeframe trend analysis.
🔹 FEATURES
Market Structure Analysis
Automatically detects swing highs and swing lows
Labels each pivot with its structure type: HH (Higher High), HL (Higher Low), LH (Lower High), LL (Lower Low)
Color-coded zigzag lines based on confirmed trend direction
Structure Trendlines
Downtrend Line: Connects HH to LH (resistance in bearish structure)
Uptrend Line: Connects LL to HL (support in bullish structure)
Extended projection for potential future price interaction
Swing Trendlines
Connects the last 2 swing highs (resistance trendline)
Connects the last 2 swing lows (support trendline)
Optional extension to project future levels
Break Levels
Horizontal lines at key structure points (HH, HL, LL, LH)
Visual reference for potential breakout/breakdown levels
Customizable colors for bullish and bearish breaks
Fibonacci Retracement
Auto-drawn between the last two pivots
Customizable levels: 0, 0.236, 0.382, 0.5, 0.618, 0.786, 1.0
Individual toggle and color settings for each level
Multi-Timeframe Dashboard
Displays trend status across 3 customizable timeframes
Shows trend direction: Bullish / Bearish / Neutral
Shows confirmation status: Confirmed / Unconfirmed
Color-coded for quick visual analysis
Trend Confirmation Logic (ICT/SMC Concepts)
Bullish Confirmed: HL followed by HH (Higher Low → Higher High pattern)
Bearish Confirmed: LH followed by LL (Lower High → Lower Low pattern)
Unconfirmed: Counter-structure appears (potential reversal signal)
🔹 SETTINGS
Swing Settings
Depth: Lookback period for pivot detection
Display
Toggle zigzag lines, labels, price on labels
Adjust label size and number of visible swings
Zigzag Settings
Line style: Solid, Dashed, Dotted
Thickness and colors for bullish/bearish trends
Swing Trendlines
Toggle high/low trendlines independently
Customizable colors, style, thickness
Option to extend trendlines
Structure Trendlines
Toggle HH→LH and LL→HL lines independently
Customizable colors, style, thickness
Option to extend trendlines
Break Levels
Toggle HH, HL, LL, LH break levels independently
Customizable colors for each level
Fibonacci
Toggle individual fib levels
Customizable colors and line style
Dashboard
Position: Top Left, Top Right, Bottom Left, Bottom Right
Size: Tiny, Small, Normal, Large
3 customizable timeframes
🔹 ALERTS
HH Broken: Price breaks above recent Higher High
HL Broken: Price breaks below recent Higher Low
LL Broken: Price breaks below recent Lower Low
LH Broken: Price breaks above recent Lower High
🔹 USE CASES
✅ Identify market structure and trend direction
✅ Spot potential trend reversals (unconfirmed status)
✅ Find key support/resistance levels
✅ Multi-timeframe trend alignment for trade confirmation
✅ Breakout/breakdown trading with break levels
✅ Fibonacci retracement entries
Invite-only script
Only users approved by the author can access this script. You'll need to request and get permission to use it. This is typically granted after payment. For more details, follow the author's instructions below or contact Swing_elite directly.
TradingView does NOT recommend paying for or using a script unless you fully trust its author and understand how it works. You may also find free, open-source alternatives in our community scripts.
Author's instructions
Disclaimer
Invite-only script
Only users approved by the author can access this script. You'll need to request and get permission to use it. This is typically granted after payment. For more details, follow the author's instructions below or contact Swing_elite directly.
TradingView does NOT recommend paying for or using a script unless you fully trust its author and understand how it works. You may also find free, open-source alternatives in our community scripts.