PROTECTED SOURCE SCRIPT
MA Distance Indicator
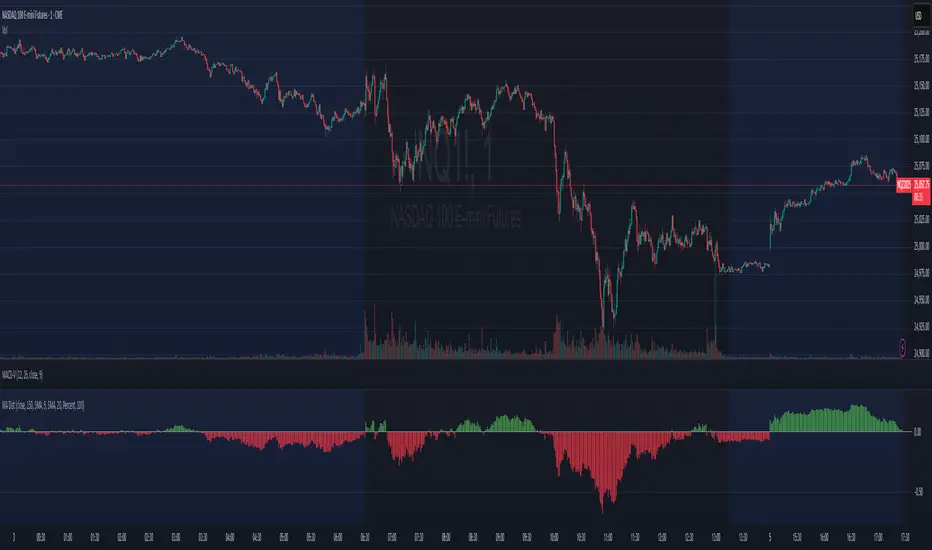
The distance from a moving average is a common way to look at how extended a stock is. This simplifies it a bit by plotting the distance below the chart, so you don't have to eyeball estimate it.
This indicator allows plotting the distance from 2 MAs, one is a histogram and one is a line.
The line MA is off by default.
The scale factor is in case you are using it intraday, it helps with small multiples of the Moving Average that would be common intraday.
"Scale by" lets you decide if the distance is measured as a percentage of the moving average level or as a count of ATRs.
Protected script
This script is published as closed-source. However, you can use it freely and without any limitations – learn more here.
Disclaimer
The information and publications are not meant to be, and do not constitute, financial, investment, trading, or other types of advice or recommendations supplied or endorsed by TradingView. Read more in the Terms of Use.