PROTECTED SOURCE SCRIPT
% Away from x DMA
% Away from X DMA
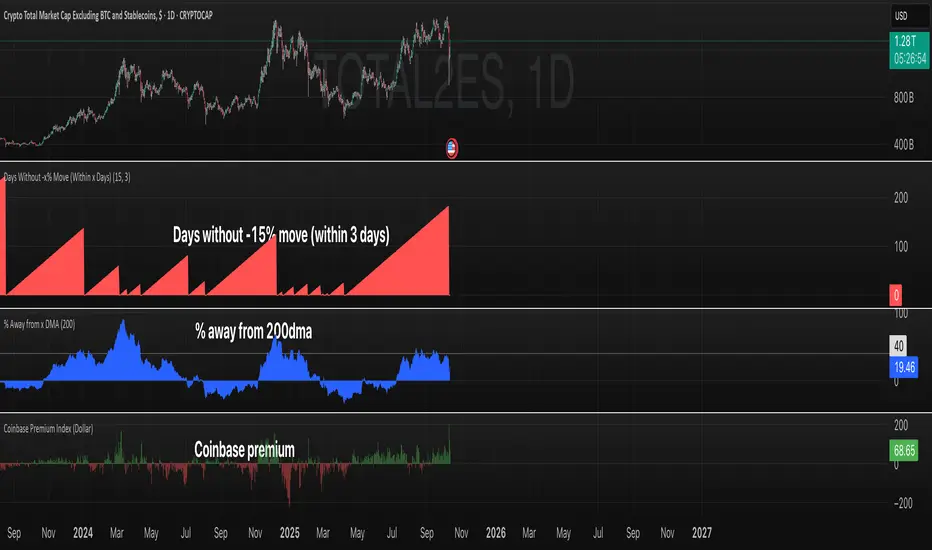
This indicator measures how far the current price is from a chosen moving average, expressed as a percentage. It helps identify overbought/oversold conditions and
mean reversion opportunities.
How It Works:
- Calculates a Simple Moving Average (SMA) for the specified period
- Measures the percentage distance between current price and the moving average
- Positive values indicate price is above the average
- Negative values indicate price is below the average
Key Features:
- Flexible Period: Customize the moving average length (default: 200 DMA)
- Percentage-Based: Standardized measurement works across all price ranges
- Visual Clarity: Blue area plot makes deviations easy to spot
- Universal Application: Works with any asset or timeframe
Trading Applications:
- Mean Reversion: Extreme values often precede reversals back to the mean
- Trend Strength: Large positive values indicate strong uptrends
- Support/Resistance: Major moving averages act as dynamic support/resistance
- Entry Timing: Buy dips when significantly below, sell rallies when extended above
- Risk Management: Avoid entries during extreme deviations
Common Settings:
- 20 DMA: Short-term trend and swing trading
- 50 DMA: Intermediate trend analysis
- 200 DMA: Long-term trend and major support/resistance (default)
Interpretation Guidelines:
- +/-5-10%: Normal price action
- +/-10-20%: Extended move, caution warranted
- +/-20%+: Extreme deviation, high probability mean reversion setup
Ideal for swing traders, mean reversion strategies, and identifying optimal entry/exit points relative to trend.
Protected script
This script is published as closed-source. However, you can use it freely and without any limitations – learn more here.
Disclaimer
The information and publications are not meant to be, and do not constitute, financial, investment, trading, or other types of advice or recommendations supplied or endorsed by TradingView. Read more in the Terms of Use.