OPEN-SOURCE SCRIPT
Price vs 10/50DMA (%) — single label
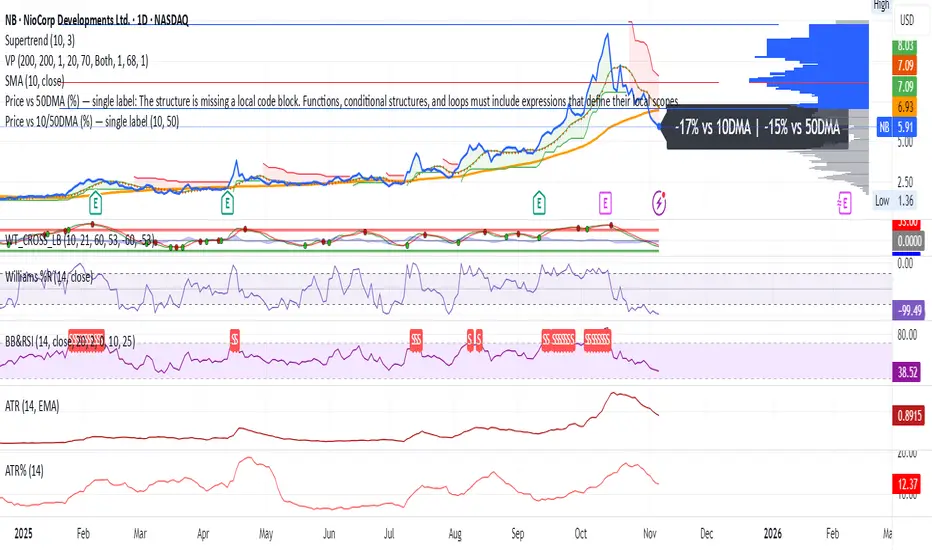
This TradingView script shows how far the current price is from its 10-day and 50-day moving averages (DMAs), expressed as percentages, and displays both values as a single label near the latest candle — for example, “+3% vs 10DMA | +8% vs 50DMA.” You can switch between simple and exponential moving averages using the “Use EMA” checkbox, and adjust the period lengths in the input panel. To use it, simply copy the code into TradingView’s Pine Editor, click Add to chart, and you’ll see one live label updating each bar along with the plotted 10- and 50-day average lines.
Open-source script
In true TradingView spirit, the creator of this script has made it open-source, so that traders can review and verify its functionality. Kudos to the author! While you can use it for free, remember that republishing the code is subject to our House Rules.
Ex-Fidelity analyst.
Love markets.
Love markets.
Disclaimer
The information and publications are not meant to be, and do not constitute, financial, investment, trading, or other types of advice or recommendations supplied or endorsed by TradingView. Read more in the Terms of Use.