Moving Average CrossoverSimple moving average crossover configurable by period.
The indicator displays a bullish crossover with a green circle and a bearish crossover with a red circle just below or above the candle where the moving average crossover occurs.
Simple Moving Average (SMA)

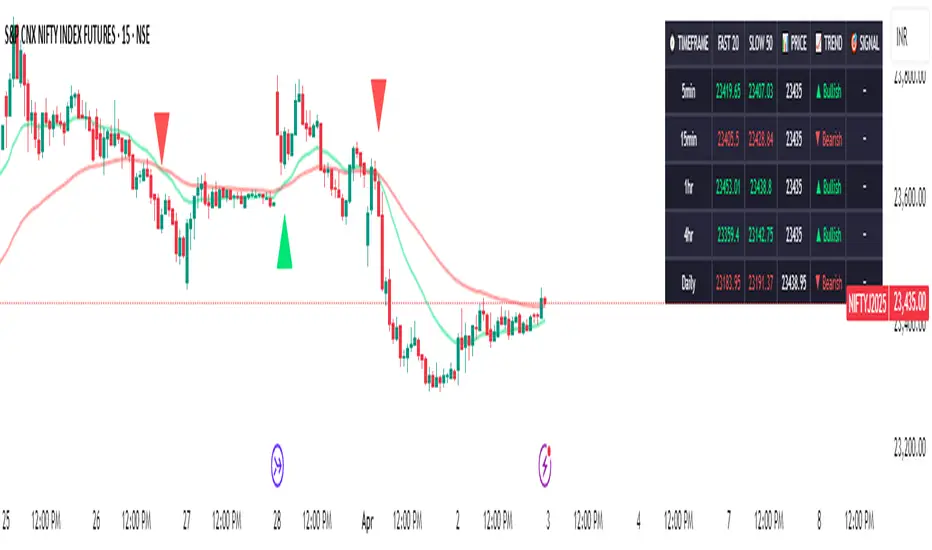
Multi-Timeframe MA DashboardThis indicator monitors 5 timeframes: 5min, 15min, 1hr, 4hr, and Daily. It displays fast and slow moving averages for each timeframe, along with the current price. The trend direction is color-coded: green for bullish (fast MA above slow MA) and red for bearish (fast MA below slow MA).
The dashboard also shows the last crossover signal (Buy/Sell) for each timeframe.
Visual arrows are plotted on the chart for the current timeframe. A green up arrow indicates a potential bullish crossover (Buy signal), while a red down arrow indicates a potential bearish crossover (Sell signal).
The dashboard is elegant and professional, with alternating row colors for better readability. It can be placed in any corner of the screen and customized with user-defined colors for bullish and bearish trends.
Alerts are triggered when a crossover occurs on any timeframe. These alerts include the timeframe and signal type (e.g., "5min: ↑ BUY").
How to Read the Indicator
The dashboard displays the following for each timeframe:
Fast MA: The value of the fast moving average.
Slow MA: The value of the slow moving average.
Price: The current price for the timeframe.
Trend: The current trend direction (Bullish or Bearish).
Signal: The last crossover signal (↑ BUY or ↓ SELL).
On the chart, green up arrows indicate a bullish crossover (Fast MA crosses above Slow MA), while red down arrows indicate a bearish crossover (Fast MA crosses below Slow MA).
Green text in the dashboard indicates a bullish trend or signal, while red text indicates a bearish trend or signal.
How to Use the Indicator
Use the dashboard to monitor the trend direction across multiple timeframes. Look for confluence (agreement) between timeframes to identify stronger trends. Observe the "Signal" column in the dashboard for the last crossover on each timeframe. Use the arrows on the chart to identify potential crossover points for the current timeframe.
Enable alerts to be notified of crossover signals on any timeframe. Alerts include the timeframe and signal type for easy reference.
Adjust the fast and slow moving average lengths to suit your trading style. Choose between EMA, SMA, or WMA for the moving average type. Customize the dashboard placement and colors for better visibility.
Important Notes
This indicator is not a buy or sell recommendation. It is a tool to assist traders in their analysis. Always use this indicator in conjunction with other tools, such as support/resistance levels, volume analysis, and price action. Past performance of moving averages does not guarantee future results.
How to Add the Indicator
Add the indicator to your chart from the TradingView library. Configure the inputs:
Fast MA Length: Default is 20.
Slow MA Length: Default is 50.
MA Type: Choose between EMA, SMA, or WMA.
Dashboard Placement: Select the corner of the screen where the dashboard will appear.
Colors: Customize the colors for bullish and bearish trends.
Monitor the dashboard and chart for trends and signals.
Disclaimer
This indicator is for educational and informational purposes only. It does not provide financial, investment, or trading advice. Always perform your own analysis and consult with a financial advisor before making trading decisions.
SMA Strategy Builder: Create & Prove Profitability📄 Pine Script Strategy Description (For Publishing on TradingView)
🎯 Strategy Title:
SMA Strategy Builder: Create & Prove Profitability
✨ Description:
This tool is designed for traders who want to build, customize, and prove their own SMA-based trading strategies. The strategy tracks capital growth in real-time, providing clear evidence of profitability after each trade. Users can adjust key parameters such as SMA period, take profit levels, and initial capital, making it a flexible solution for backtesting and strategy validation.
🔍 Key Features:
✅ SMA-Based Logic:
Core trading logic revolves around the Simple Moving Average (SMA).
SMA period is fully adjustable to suit various trading styles.
🎯 Customizable Take Profit (TP):
User-defined TP percentages per position.
TP line displayed as a Step Line with Breaks for clear segmentation.
Visual 🎯TP label for quick identification of profit targets.
💵 Capital Tracking (Proof of Profitability):
Initial capital is user-defined.
Capital balance updates after each closed trade.
Shows both absolute profit/loss and percentage changes for every position.
Darker green profit labels for better readability and dark red for losses.
📈 Capital Curve (Performance Visualization):
Capital growth curve available (hidden by default, can be enabled via settings).
📏 Dynamic Label Positioning:
Label positions adjust dynamically based on the price range.
Ensures consistent visibility across low and high-priced assets.
⚡ How It Works:
Long Entry:
Triggered when the price crosses above the SMA.
TP level is calculated as a user-defined percentage above the entry price.
Short Entry:
Triggered when the price crosses below the SMA.
TP level is calculated as a user-defined percentage below the entry price.
TP Execution:
Positions close immediately once the TP level is reached (no candle close confirmation needed).
🔔 Alerts:
🟩 Long Signal Alert: When the price crosses above the SMA.
🟥 Short Signal Alert: When the price crosses below the SMA.
🎯 TP Alert: When the TP target is reached.
⚙️ Customization Options:
📅 SMA Period: Choose the moving average period that best fits your strategy.
🎯 Take Profit (%): Adjust TP percentages for flexible risk management.
💵 Initial Capital: Set the starting capital for realistic backtesting.
📈 Capital Curve Toggle: Enable or disable the capital curve to track overall performance.
🌟 Why Use This Tool?
🔧 Flexible Strategy Creation: Adjust core parameters and create tailored SMA-based strategies.
📈 Performance Proof: Capital tracking acts as real proof of profitability after each trade.
🎯 Immediate TP Execution: No waiting for candle closures; profits lock in as soon as targets are hit.
💹 Comprehensive Performance Insights: Percentage-based and absolute capital tracking with dynamic visualization.
🏦 Clean Visual Indicators: Strategy insights made clear with dynamic labeling and adjustable visuals.
⚠️ Disclaimer:
This script is provided for educational and informational purposes only. Trading financial instruments carries risk, and past performance does not guarantee future results. Always perform your own due diligence before making any trading decisions.


Global Foreigners SMA, WMA IndicatorThis Indicator is a custom technical analysis tool designed to overlay multiple moving averages on a price chart, helping traders analyze price trends and potential trading opportunities.
It features both a Simple Moving Average (SMA) and Weighted Moving Averages (WMAs) with different period settings.
Key Features:
1. SMA and WMA Calculations:
- SMA 1: A simple moving average (SMA) calculated over a user-defined period (default: 1).
- WMA 1 - WMA 5: Five weighted moving averages (WMA) with different periods (5, 10, 20, 30, 40). WMAs give more importance to recent price movements, helping to identify short-term trends.
2. Customizable Periods:
- The indicator allows users to adjust the lookback period for each moving average via input settings.
3. Color-Coded Moving Averages:
- Each moving average is assigned a unique color for easy differentiation:
- SMA 1 → Black
- WMA 1 (5-period) → Blue
- WMA 2 (10-period) → Peach
- WMA 3 (20-period) → Orange
- WMA 4 (30-period) → Lavender
- WMA 5 (40-period) → Purple
4. Line Thickness:
- Each moving average is plotted with a line width of 2, making them clearly visible on the chart.
How This Indicator is Used:
Trend Analysis:
The alignment of the WMA sequence (e.g., WMA 5 > WMA 4 > WMA 3 > WMA 2 > WMA 1) can
indicate a bullish trend.
The opposite alignment suggests a bearish trend.
Dynamic Support & Resistance:
Shorter-period WMAs (5 & 10) react faster to price changes and can be used as dynamic
support or resistance levels for short-term trades.
Longer-period WMAs (20, 30, 40) smooth out price fluctuations and are useful for detecting
long-term trends.
Signal Confirmation:
The SMA 1 acts as a quick price reference, and traders can look for crossovers between the
WMA lines to confirm trend changes.
Who Can Use This Indicator?
Scalpers & Day Traders:
The faster WMAs (5 & 10) can be used to catch quick price reversals.
Swing Traders & Position Traders:
The combination of short-term and long-term moving averages helps identify key trend
shifts.
Algorithmic Traders:
Can be used alongside other indicators for automated signal generation.
This indicator is not a buy/sell signal generator but rather a trend-following tool that helps traders visually interpret market movements using moving averages. It works well when combined with momentum indicators (e.g., MACD, RSI) to confirm entry and exit points.

Crypto MA Cross StrategyBuy with MA crossover. Take profit when price reaches your percentage target. Stops at defined percentage below the buy price

SMA 12, 36, 200 with Signals and AlertsFeatures:
✅ Simple Moving Averages:
SMA 12 (short-term)
SMA 36 (mid-term)
SMA 200 (long-term trend filter)
✅ Buy & Sell Signals:
Buy: When SMA 12 crosses above SMA 36
Sell: When SMA 12 crosses below SMA 36
✅ Built-in Alerts:
Receive real-time alerts when a signal is triggered.
🧠 Strategy Overview – Multi-Timeframe Trading
This script is designed to be used with multi-timeframe analysis:
1H Chart – Trend Direction
If the price is above the SMA 200 on the 1-hour chart → look for Long opportunities.
If the price is below the SMA 200 on the 1-hour chart → look for Short opportunities.
5-Min Chart – Entry Timing
Once the higher-timeframe trend is clear, switch to the 5-minute chart.
Use SMA 12 and SMA 36 crossovers to time your entry in the direction of the main trend.
This approach helps filter out false signals and improves overall trade accuracy.

MA CloudsMA Clouds – Adaptive Moving Average Visualization (with Bollinger bands)
The MA Clouds indicator is designed to help traders visualize multiple moving averages simultaneously, providing a dynamic view of trend direction, momentum, and potential support/resistance zones. This tool overlays Simple Moving Averages (SMA) and Exponential Moving Averages (EMA) in an easy-to-read cloud format, allowing traders to interpret market structure at a glance.
Key Features:
✅ Customizable Moving Averages – Adjust SMA and EMA lengths to suit your strategy.
✅ Cloud-Based Visualization – Color-coded clouds between different moving averages highlight areas of potential trend shifts.
✅ Toggle Price Lines – Option to enable or disable individual price lines for a cleaner chart.
✅ Bollinger Bands Integration – Adds upper and lower bands for additional confluence in volatility analysis.
✅ Quick Trend Identification – Helps traders gauge short-term and long-term trend strength.
✅ Preset View Modes – Toggle between a simplified 5-10 SMA/EMA setup or a full multi-timeframe cloud setup with one click.
This indicator is ideal for traders looking to combine trend-following strategies with dynamic support/resistance insights. Whether you're scalping intraday moves or managing longer-term swing trades, MA Clouds provides an efficient way to keep market structure in focus.

111D SMA / (350D SMA * 2)Indicator: Pi Cycle Ratio
This custom technical indicator calculates a ratio between two moving averages that are used for the PI Cycle Top indicator. The PI Cycle Top indicator triggers when the 111-day simple moving average (111D SMA) crosses up with the 350-day simple moving average (350D SMA *2).
The line value is ratio is calculated as:
Line Value = 111DSMA / (350D SMA × 2)
When the 111D SMA crosses with the 350D SMA triggering the PI Cycle Top, the value of the ratio between the two lines is 1.
This visualizes the ratio between the two moving averages into a single line. This indicator can be used for technical analysis for historical and future moves.


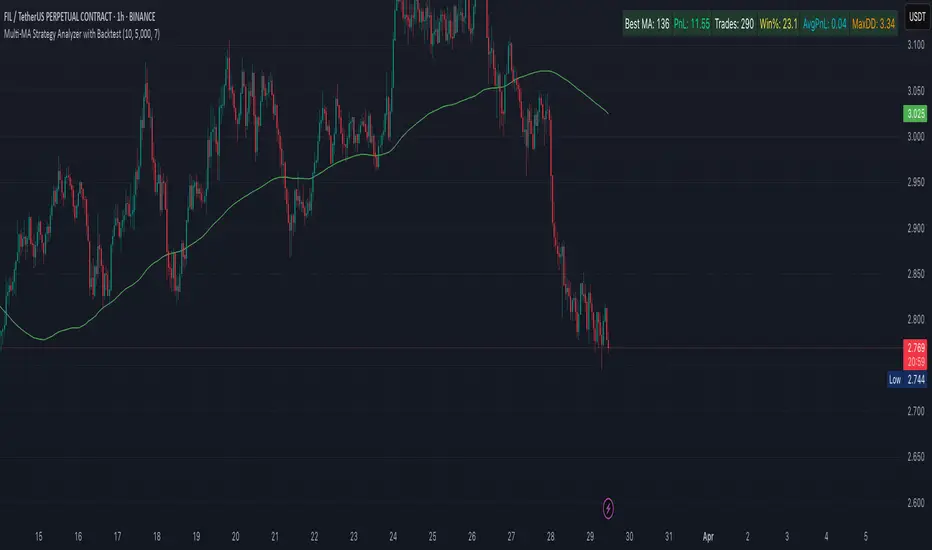
Multi-MA Strategy Analyzer with BacktestMulti-MA Strategy Analyzer with Backtest
This TradingView Pine Script indicator is designed to analyze multiple moving averages (SMA or EMA) dynamically and identify the most profitable one based on historical performance.
Features
Dynamic MA Range:
Specify a minLength, maxLength, and step size.
Automatically calculates up to 20 MAs.
Custom MA Calculation:
Uses custom SMA and EMA implementations to support dynamic length values.
Buy/Sell Logic:
Buy when price crosses above a MA.
Sell when price crosses below.
Supports both long and short trades.
Performance Tracking:
Tracks PnL, number of trades, win rate, average profit, and drawdown.
Maintains individual stats for each MA.
Best MA Detection:
Automatically highlights the best-performing MA.
Optional showBestOnly toggle to focus only on the best line and its stats.
Visualization:
Up to 20 plot() calls (static) for MAs.
Green highlight for the best MA.
Color-coded result table and chart.
Table View
When showBestOnly = false, the table displays all MAs with stats.
When showBestOnly = true, the table displays only the best MA with a summary row.
Includes:
Best MA length
Total PnL
Number of trades
Win rate
Avg PnL per trade
Max Drawdown
Configuration
minLength (default: 10)
maxLength (default: 200)
step (default: 10)
useEMA: Toggle between EMA and SMA
showBestOnly: Focus on best-performing MA only
Notes
MA plotting is static, limited to 20 total.
Table supports highlighting and is optimized for performance.
Script is structured to run efficiently using arrays and simple int where required.
Potential Extensions
Add visual buy/sell arrows
Export stats to CSV
Strategy tester conversion
Custom date range filtering for backtesting
Author: Muhammad Wasim
Version: 1.0
Regime Filter IndicatorRegime Filter – Crypto Market Trend Indicator
📊 Overview
The Regime Filter is a powerful market analysis indicator designed specifically for crypto trading. It helps traders identify whether the market is in a bullish or bearish phase by analyzing key assets in the cryptocurrency market, including Bitcoin (BTC), Bitcoin Dominance (BTC.D), and the Altcoin Market (TOTAL3). The indicator compares these assets against their respective Simple Moving Averages (SMA) to determine the overall market regime, allowing traders to make more informed decisions.
🔍 How It Works
The Regime Filter evaluates three main components to determine the market's sentiment:
1. BTC Dominance (BTC.D) vs. 40 SMA (Medium Timeframe)
The Bitcoin Dominance (BTC.D) is compared to its 40-period SMA on a mid-timeframe (e.g.,
1-hour). If BTC.D is below the 40 SMA, it indicates that altcoins are performing well relative
to Bitcoin, suggesting a bullish altcoin market. If BTC.D is above the 40 SMA, Bitcoin is
gaining dominance, indicating a potential bearish phase for altcoins.
2. TOTAL3 Market Cap vs. 100 SMA (Medium Timeframe)
The TOTAL3 index, which tracks the total market capitalization of all cryptocurrencies except
Bitcoin and Ethereum, is compared to its 100-period SMA. A bullish signal occurs when TOTAL3
is above the 100 SMA, indicating strength in altcoins, while a bearish signal occurs when
TOTAL3 is below the 100 SMA, signaling a potential weakness in the altcoin market.
3. BTC Price vs. 200 SMA (Higher Timeframe)
The current Bitcoin price is compared to its 200-period Simple Moving Average (SMA) on a
higher timeframe (e.g., 4-hour). A bullish signal is given when the BTC price is above the 200
SMA, and a bearish signal when it's below.
🟢 Bullish Market Conditions
The market is considered bullish when:
- BTC Dominance (BTC.D) is below the 40 SMA, suggesting altcoins are gaining momentum.
- TOTAL3 Market Cap is above the 100 SMA, signaling strength in the altcoin market.
- BTC price is above the 200 SMA, indicating an uptrend in Bitcoin.
In these conditions, the background turns green 🟢, and a "Bullish" label is displayed on the chart.
🔴 Bearish Market Conditions
The market is considered bearish when:
- BTC Dominance (BTC.D) is above the 40 SMA, indicating Bitcoin is outperforming altcoins.
- TOTAL3 Market Cap is below the 100 SMA, signaling weakness in altcoins.
- BTC price is below the 200 SMA, indicating a downtrend in Bitcoin.
In these conditions, the background turns red 🔴, and a "Bearish" label appears on the chart.
⚙ Customization Options
- The Regime Filter offers flexibility for traders:
- Enable or Disable Specific SMAs: Customize the indicator by enabling or disabling the 200 SMA for Bitcoin, the 40 SMA for BTC Dominance, and the 100 SMA for TOTAL3.
- Adjust Timeframes: Choose the timeframes for each of the moving averages to suit your preferred trading strategy.
- Real-Time Data Adjustments: The indicator updates in real-time to reflect current market conditions, ensuring timely analysis.
📈 Best Use Cases
- Trend Confirmation: The Regime Filter is ideal for confirming the market's overall trend,
helping traders to align their positions with the dominant market sentiment.
- Trade Entry/Exit Signals: Use the indicator to identify favorable entry or exit points based on
whether the market is in a bullish or bearish phase.
- Market Overview: Gain a quick understanding of the broader crypto market, with a focus on
Bitcoin and altcoins, to make more strategic decisions.
⚠️ Important Notes
Trend-Following Indicator: The Regime Filter is a trend-following tool, meaning it works best in strong trending markets. It may not perform well in choppy, sideways markets.
Risk Management: This indicator is designed to assist in identifying market trends, but it does not guarantee profits. Always apply sound risk management strategies and use additional indicators when making trading decisions.
Not a Profit Guarantee: While this indicator can help identify potential market trends, no trading tool or strategy guarantees profits. Please trade responsibly and ensure that your decisions are based on comprehensive analysis and risk tolerance.

Three Simple Moving AveragesThis script provides three common Simple Moving Averages (SMAs) in a single indicator.

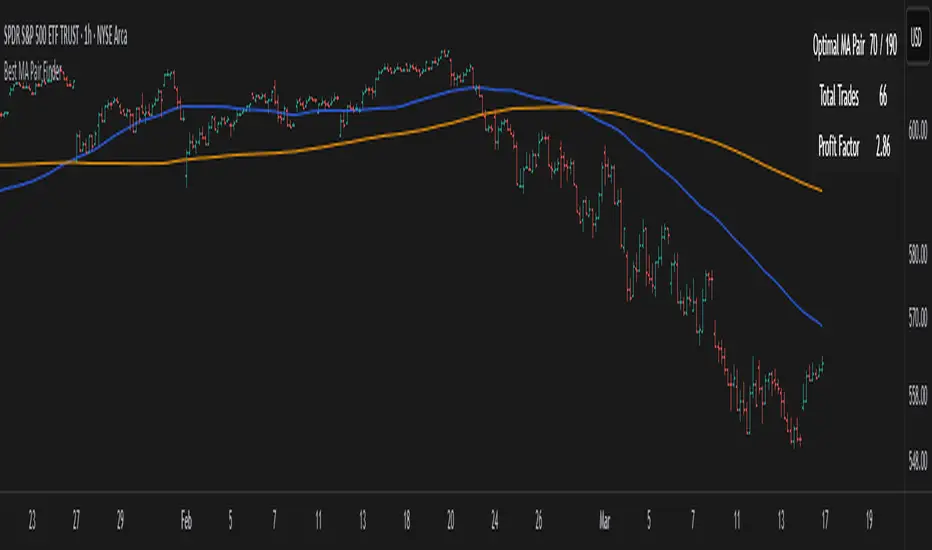
MA SniperThis indicator automatically finds the most effective moving average to use in a price crossover strategy—so you can focus on trading, not testing. It continuously evaluates a wide range of moving average periods, ranks them based on real-time market performance, and selects the one delivering the highest quality signals. The result? A smarter, adaptive tool that shows you exactly when price crosses its optimal moving average—bullish signals in green, bearish in red.
What makes it unique is the way it thinks.
Under the hood, the script doesn’t just pick a random MA or let you choose one manually. Instead, it backtests a large panel of moving average lengths for the current asset and timeframe. It evaluates each one by calculating its **Profit Factor**—a key performance metric used by pros to measure the quality of a strategy. Then, it assigns each MA a score and ranks them in a clean, built-in table so you can see, at a glance, which ones are currently most effective.
From that list, it picks the top-performing MA and uses it to generate live crossover signals on your chart. That MA is plotted automatically, and the signals adapt in real-time. This isn’t a static setup—it’s a dynamic system that evolves as the market evolves.
Even better: the indicator detects the type of instrument you’re trading (forex, stocks, etc.) and adjusts its internal calculations accordingly, including how many bars per day to consider. That means it remains highly accurate whether you’re trading EURUSD, SPX500, or TSLA.
You also get a real-time dashboard (via the table) that acts as a transparent scorecard. Want to see how other MAs are doing? You can. Want to understand why a certain MA was selected? The data is right there.
This tool is for traders who love crossover strategies but want something smarter, faster, and more precise—without spending hours manually testing. Whether you're scalping or swing trading, it offers a data-driven edge that’s hard to ignore.
Give it a try—you’ll quickly see how powerful it can be when your MA does the thinking for you.
This tool is for informational and educational purposes only. Trading involves risk, and past performance does not guarantee future results. Use responsibly.

SMA7 Tail Reversal📌 Description:
The SMA7 Tail Reversal indicator is designed to identify potential counter-trend trading opportunities by checking if candle wicks (tails) respect a key moving average level (SMA7).
This indicator highlights price action where candles are clearly separated from the moving average, suggesting a possible reversal or temporary correction.
📌 How It Works:
Moving Average Calculation:
Calculates a simple moving average (SMA) of length 7 to act as the primary trend filter.
Candle Classification:
Bullish Candle: A candle where the closing price is higher than the opening price, with a short upper wick.
Bearish Candle: A candle where the closing price is lower than the opening price, with a short lower wick.
Conditions for Coloring Candles:
Long Condition (Green Candle):
High & Low are both below the SMA7 line.
Volume is above the 20-period average.
A bullish candle is detected.
Short Condition (Red Candle):
High & Low are both above the SMA7 line.
Volume is above the 20-period average.
A bearish candle is detected.
📌 Visual Representation:
Green Candles: Potential long signals when price action stays below the SMA7 line.
Red Candles: Potential short signals when price action stays above the SMA7 line.
Yellow Line: SMA7, used as the dynamic threshold for signal generation.
📌 Usage:
Best applied to volatile markets with clear trends.
Effective in detecting counter-trend opportunities where price diverges from the SMA7 line.
Works well with additional confirmation tools for better accuracy.
Trend Catcher SwiftEdgeTrend Catcher SwiftEdge
Overview
The Trend Catcher SwiftEdge is a simple yet effective tool designed to help traders identify potential trend directions using two Simple Moving Averages (SMAs). It plots two SMAs based on the high and low prices of the chart, visually highlights trend conditions, and provides buy/sell labels to assist with trade entries. This indicator is best used as part of a broader trading strategy and should not be relied upon as a standalone signal generator.
How It Works
Two SMAs: The indicator calculates two SMAs: one based on the lowest price (Low) and one based on the highest price (High) over a user-defined period (default: 20).
Dynamic Colors:
Green: When the price is above both SMAs (indicating a potential uptrend).
Red: When the price is below both SMAs (indicating a potential downtrend).
Purple: When the price is between the SMAs (indicating consolidation).
The SMAs and the background between them change color dynamically to reflect the current trend condition.
Buy/Sell Labels:
A "Buy" label appears when an entire candlestick (including its low) crosses above both SMAs, marking the start of a potential uptrend.
A "Sell" label appears when an entire candlestick (including its high) crosses below both SMAs, marking the start of a potential downtrend.
To reduce noise, only one label is shown per trend direction. The indicator resets when the price enters the consolidation zone (purple), allowing for a new signal when the next trend begins.
Settings
SMA Length: Adjust the period of the SMAs (default: 20). A longer period smooths the SMAs and focuses on larger trends, while a shorter period makes the indicator more sensitive to price changes.
How to Use
Add the indicator to your chart.
Look for "Buy" labels to consider potential long entries during uptrends (green zone).
Look for "Sell" labels to consider potential short entries during downtrends (red zone).
Use the purple consolidation zone to prepare for potential breakouts.
Always combine this indicator with other forms of analysis (e.g., support/resistance, volume, or other indicators) to confirm signals.
Important Notes
This indicator is a tool to assist with identifying trend directions and potential entry points. It does not guarantee profits and should be used as part of a comprehensive trading strategy.
False signals can occur, especially in choppy or ranging markets. Consider using additional filters or confirmations to improve reliability.
Backtest the indicator on your chosen market and timeframe to understand its behavior before using it in live trading.
Feedback
If you have suggestions or feedback, feel free to leave a comment. Happy trading!

Standard Deviation SMA RSI | mad_tiger_slayerOverview of the Script
The Standard Deviation SMA RSI is a custom TradingView indicator that enhances the Relative Strength Index (RSI) by incorporating a Simple Moving Average (SMA) and Standard Deviation bands . This approach smooths RSI calculations while factoring in volatility to provide clearer trend signals . Additionally, the indicator includes overbought and oversold thresholds, trend-coded RSI signals , and dynamic volatility bands for improved market analysis. This indicator is designed for swing traders and long-term investors looking to capture high-probability trend shifts.
How Do Traders Use the Standard Deviation SMA RSI?
In the provided chart image, the indicator is displayed on a price chart. Each visual component serves a distinct function in identifying trend conditions and volatility levels .
INTENDED USES
⚠️ NOT INTENDED FOR SCALPING
With the smoothing nature of the SMA-based RSI , this indicator is not designed for low-timeframe scalping. It works best on timeframes above 1-hour , with optimal performance in 12-hour, daily, and higher timeframes.
📈 TREND-FOLLOWING & MEAN REVERSION
The Standard Deviation SMA RSI functions as both a trend-following and mean-reverting indicator:
Trend-Following: Identifies strong, sustained trends using RSI signals and SMA confirmation.
Mean Reversion: Detects overbought/oversold conditions based on standard deviation bands and RSI thresholds .
A VISUAL REPRESENTATION OF INTENDED USES
RSI Line (Green/Pink/Gray): The RSI line dynamically changes color based on trend conditions .
Green RSI → Strong uptrend, RSI above the uptrend threshold.
Pink RSI → Downtrend, RSI below the downtrend threshold.
Gray RSI → Neutral state or consolidation.
If the SMA of RSI is above Long Threshold , the market is in a bullish trend.
If it’s below Short Threshold, bearish conditions prevail.
Threshold Lines (Teal/Purple):
Green Line → Long Entry Threshold
Red Line → Short Entry Threshold
Standard Deviation Bands:
Upper Band → Measures bullish volatility expansion
Lower Band → Measures bearish volatility expansion
Colored Candles: Price candles adjust color based on RSI conditions , visually aligning price action with market trends.
Indicator's Primary Elements
Input Parameters
The script includes several configurable settings, allowing users to tailor the indicator to different market environments:
RSI Length: Controls the number of periods for RSI calculations.
SMA Length: Defines the period for the SMA applied to RSI , creating a smoothed trend line.
Standard Deviation Period: Determines the length for volatility calculations.
Overbought and Oversold Levels:
Can be adjusted to customize sensitivity.
Standard Deviation SMA RSI Calculation
The SMA-based RSI smooths fluctuations while the standard deviation bands measure price volatility.
Upper and Lower Bands: Calculated by adding/subtracting standard deviation to/from the SMA-based RSI.
Trend Signal Calculation:
RSI is compared to uptrend and downtrend thresholds to determine buy/sell conditions.
Long and Short Conditions
Buy and sell conditions are determined by RSI relative to key thresholds :
Bullish Signal: RSI above long threshold & SMA confirms trend .
Bearish Signal: RSI below short threshold & SMA confirms downtrend .
Reversals: RSI entering overbought/oversold areas suggests possible trend reversals.
Conclusion
The Standard Deviation SMA RSI is a powerful trend-following and mean-reverting tool , offering enhanced insights into RSI movements, volatility, and market strength . By combining SMA smoothing, standard deviation bands, and dynamic thresholds , traders can better identify trend confirmations, reversals, and overextended conditions .
✅ Customizable settings allow traders to optimize sensitivity.
✅ Works best on high timeframes (12H, Daily, Weekly).
✅ Ideal for swing traders and long-term investors.

Golden Death Cross IndicatorThis indicator uses moving average to detect both a Golden Cross and Death Cross on any timeframe but is recommended for use on the daily and 24 hour timeframes only.
We have also provided instructions on how to create alerts for these indicators below.
Happy Trading!
Moving Averages: We’ll use Simple Moving Averages (SMA). The 50-day SMA looks at the average price over the last 50 periods, and the 200-day SMA does the same for 200 periods.
Crossovers: We’ll check when the 50-day SMA crosses above (Golden Cross) or below the 200-day SMA (Death Cross).
Set Up Alerts
Now, let’s make sure you get notified when a cross happens:
Open the Alerts Menu
On the chart, click the bell icon (top right of the screen) to create an alert.
Configure the Golden Cross Alert
In the “Condition” dropdown, select “Cross Alerts” (the name of your script).
Below that, select “Golden Cross.”
Set “Once Per Bar Close” in the next dropdown (this ensures it only triggers after the period ends, avoiding false signals mid-bar).
Choose how you want to be notified (e.g., popup, email, or phone app—set this under “Notifications”).
Name the alert (e.g., “Golden Cross Alert”) and click “Create.”
Configure the Death Cross Alert
Click the bell icon again to create a second alert.
Condition: “Cross Alerts” > “Death Cross.”
Set “Once Per Bar Close” again.
Choose your notification method.
Name it (e.g., “Death Cross Alert”) and click “Create.”

Smart MA CrossoverThe Smart MA Crossover indicator is a trend-following tool designed to help traders identify high-probability buy and sell signals based on a dynamic moving average and volume confirmation.
This indicator allows traders to customize the moving average type (SMA, EMA, HMA, WMA, VWMA, SMMA, or VWAP) while incorporating an ATR-based filter for better signal clarity.
How It Works
The script analyzes price movements in relation to a selected moving average and volume conditions to generate trend-based trade signals:
🟢 Buy Signal:
- Price is trading above the moving average for at least two bars.
- A sudden upward momentum is detected (price > open * 1.005).
- Volume is higher than the 50-period SMA of volume.
- The price was trading below the moving average three bars ago.
🔴 Sell Signal:
- Price is trading below the moving average for at least two bars.
- A sudden downward movement is detected (price < open * 0.995).
- Volume is higher than the 50-period SMA of volume.
- The price was trading above the moving average three bars ago.
- When these conditions are met, a label appears on the chart, marking the potential trade signal.
Key Features
- Customizable Moving Averages – Choose between SMA, EMA, HMA, WMA, VWMA, SMMA, or VWAP.
- Dynamic Trend Detection – Moving average color changes based on trend direction.
- Volume Confirmation – Avoid false signals by filtering trades using SMA-based volume analysis.
- ATR-Based Signal Placement – Labels are positioned dynamically based on ATR values to improve visibility.
- Background Trend Highlighting – The background changes color depending on whether price is above (green) or below (red) the moving average.
- Alerts for Buy & Sell Signals – Get real-time notifications when a trade signal is generated.
How to Use
- This indicator is best suited for trend-following strategies and works across different markets, including stocks, forex, and crypto.
- It can be used on multiple timeframes, but traders should combine it with additional analysis to refine trade decisions.
- ATR-based signal placement ensures that buy/sell labels do not clutter the chart.
Important Notes
- This indicator does not predict future price movements—it is a trend-based tool meant to assist with trade decisions.
- No financial advice – Always use risk management when trading.
- TradingView users who do not read Pine Script can still fully utilize this script thanks to clear labels and alerts.

Best MA Pair Finder (Crossover Strategy)This indicator automatically identifies the optimal pair of moving averages (MAs) for a crossover strategy using all available historical data. It offers several MA options—including SMA, EMA, and TEMA—allowing users to select the desired type in the settings. The indicator supports two strategy modes: “Long Only” and “Buy & Sell”, which can be chosen via the options.
For each MA pair combination, the indicator performs a backtest and calculates the profit factor, considering only those pairs where the total number of trades meets or exceeds the user-defined "Minimum Trades" threshold. This parameter ensures that the selected optimal pair is based on a statistically meaningful sample rather than on a limited number of trades.
The results provided by this indicator are based on historical data and backtests, which may not guarantee future performance. Users should conduct their own analysis and use proper risk management before making trading decisions.
ROC + SMI Auto Adjust
This indicator combines the Rate of Change (ROC) and the Stochastic Momentum Index (SMI) with automatically adjusted parameters for different time frames (short, medium, long). It normalizes the ROC to match the SMI levels, displays the ROC as a histogram and the SMI as lines, highlights overbought/oversold zones and includes a settings table. Ideal for analyzing momentum on different time frames.
Key Features:
Automatic Parameter Adjustment:
The script detects the current chart time frame (e.g. 1-minute, 1-hour, daily) and adjusts the parameters for the ROC and SMI accordingly.
Parameters such as ROC length, SMI length and smoothing periods are optimized for short, medium and long term time frames.
Rate of Change (ROC):
ROC measures the percentage change in price over a specified period.
The script normalizes the ROC values to match the SMI range, making it easier to compare the two indicators on the same scale.
The ROC is displayed as a histogram, where positive values are colored green and negative values are colored red.
Stochastic Momentum Index (SMI):
SMI is a momentum oscillator that identifies overbought and oversold conditions.
The script calculates the SMI and its signal line, plotting them on the chart.
Overbought and oversold levels are displayed as dotted lines for convenience.
SMI and SMI Signal Crossover:
When the main SMI crosses the signal line from below upwards, it may be a buy signal (bullish signal).
When the SMI crosses the signal line from above downwards, it may be a sell signal (bearish signal).
Configurable Inputs:
Users can use the automatically adjusted settings or manually override the parameters (e.g. ROC length, SMI length, smoothing periods).
Overbought and oversold levels for SMI are also configurable.
Parameter Table:
A table is displayed on the chart showing the current parameters (e.g. timeframe, ROC length, SMI length) for transparency and debugging.
The position of the table is configurable (e.g. top left, bottom right).
How it works:
The script first detects the chart timeframe and classifies it as short-term (e.g. 1M, 5M), medium-term (e.g. 1H, 4H) or long-term (e.g. D1, W1).
Based on the timeframe, it sets default values for the ROC and SMI parameters.
ROC and SMI are calculated and normalized so that they can be compared on the same scale.
ROC is displayed as a histogram, while SMI and its signal line are displayed as lines.
Overbought and oversold levels are displayed as horizontal lines.
Use cases:
Trend identification: ROC helps to identify the strength of the trend, while SMI indicates overbought/oversold conditions.
Momentum analysis: The combination of ROC and SMI provides insight into both price momentum and potential reversals.
Time frame flexibility: The auto-adjustment feature makes the script suitable for scalping (short-term), swing trading (medium-term) and long-term investing.

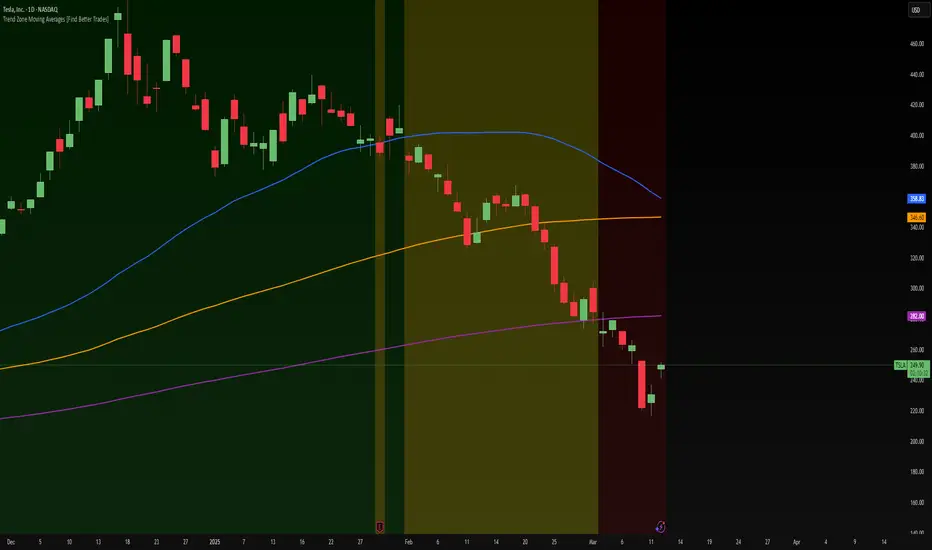
Trend Zone Moving Averages📈 Trend Zone Moving Averages
The Trend Zone Moving Averages indicator helps traders quickly identify market trends using the 50SMA, 100SMA, and 200SMA. With dynamic background colors, customizable settings, and real-time alerts, this tool provides a clear view of bullish, bearish, and extreme trend conditions.
🔹 Features:
Trend Zones with Dynamic Background Colors
Green → Bullish Trend (50SMA > 100SMA > 200SMA, price above 50SMA)
Red → Bearish Trend (50SMA < 100SMA < 200SMA, price below 50SMA)
Yellow → Neutral Trend (Mixed signals)
Dark Green → Extreme Bullish (Price above all three SMAs)
Dark Red → Extreme Bearish (Price below all three SMAs)
Customizable Moving Averages
Toggle 50SMA, 100SMA, and 200SMA on/off from the settings.
Perfect for traders who prefer a cleaner chart.
Real-Time Trend Alerts
Get instant notifications when the trend changes:
🟢 Bullish Zone Alert – When price enters a bullish trend.
🔴 Bearish Zone Alert – When price enters a bearish trend.
🟡 Neutral Zone Alert – When trend shifts to neutral.
🌟 Extreme Bullish Alert – When price moves above all SMAs.
⚠️ Extreme Bearish Alert – When price drops below all SMAs.
✅ Perfect for Any Market
Works on stocks, forex, crypto, and commodities.
Adaptable for day traders, swing traders, and investors.
⚙️ How to Use: Trend Zone Moving Averages Strategy
This strategy helps traders identify and trade with the trend using the Trend Zone Moving Averages indicator. It works across stocks, forex, crypto, and commodities.
🟢 Bullish Trend Strategy (Green Background)
Objective: Look for buying opportunities when the market is in an uptrend.
Entry Conditions:
✅ Background is Green (Bullish Zone).
✅ Price is above the 50SMA (confirming strength).
✅ Price pulls back to the 50SMA and bounces OR breaks above a key resistance level.
Stop Loss:
🔹 Place below the most recent swing low or just under the 50SMA.
Take Profit:
🔹 First target at the next resistance level or recent swing high.
🔹 Second target if price continues higher—trail stops to lock in profits.
🔴 Bearish Trend Strategy (Red Background)
Objective: Look for shorting opportunities when the market is in a downtrend.
Entry Conditions:
✅ Background is Red (Bearish Zone).
✅ Price is below the 50SMA (confirming weakness).
✅ Price pulls back to the 50SMA and rejects OR breaks below a key support level.
Stop Loss:
🔹 Place above the most recent swing high or just above the 50SMA.
Take Profit:
🔹 First target at the next support level or recent swing low.
🔹 Second target if price keeps falling—trail stops to secure profits.
🌟 Extreme Trend Strategy (Dark Green / Dark Red Background)
Objective: Trade with momentum when the market is in a strong trend.
Entry Conditions:
✅ Dark Green Background → Extreme Bullish: Price is above all three SMAs (strong uptrend).
✅ Dark Red Background → Extreme Bearish: Price is below all three SMAs (strong downtrend).
Trade Execution:
🔹 For longs (Dark Green): Look for breakout entries above resistance or pullbacks to the 50SMA.
🔹 For shorts (Dark Red): Look for breakdown entries below support or rejections at the 50SMA.
Risk Management:
🔹 Use tighter stop losses and trail profits aggressively to maximize gains.
🟡 Neutral Trend Strategy (Yellow Background)
Objective: Avoid trading or wait for a breakout.
What to Do:
🔹 Avoid trading in this zone—price is indecisive.
🔹 Wait for confirmation (background turns green/red) before taking a trade.
🔹 Use alerts to notify you when the trend resumes.
📌 Final Tips
Use this strategy with price action for extra confirmation.
Combine with support/resistance levels to improve accuracy.
Set alerts for trend changes so you never miss an opportunity.
Enjoy!
Panic Drop Stock Market Bull/Bear Market Panic Drop Bull/Bear
What It Does:
This indicator identifies bull and bear markets for the S&P 500 (or any stock/index) using the 50-period and 150-period Simple Moving Averages (SMAs). A green background signals a confirmed bull market when the 50 SMA is above the 150 SMA and the 150 SMA slope is flat or upward. A red background signals a confirmed bear market when the 50 SMA is below the 150 SMA and the 150 SMA slope is downward. The background color persists until a new confirmed state is detected, ensuring no gaps—perfect for spotting long-term market trends whether you’re a beginner, trend trader, or long-term investor.
Key Features:
Plots 50 SMA (default: blue line) and 150 SMA (default: orange line).
Background highlights: green for bull markets, red for bear markets.
Persistent background color—no gaps during unconfirmed periods.
Alerts for confirmed bull and bear market transitions.
Fully adjustable: MA periods, slope lookback, and more.
How to Use It:
Add to your S&P 500 chart (e.g., SPX or SPY) on a daily or weekly timeframe (daily default recommended for long-term trends).
Watch for background color changes:
Green background: Confirmed bull market—consider long positions or holding.
Red background: Confirmed bear market—consider shorting or exiting longs.
Customize via settings:
Adjust MA periods (default: 50 and 150).
Set slope lookback (default: 5 bars) to control slope sensitivity.
Change MA colors if desired.
Set alerts: Right-click on the chart > "Add Alert" > Select "Bull Market Confirmed" or "Bear Market Confirmed."
Trade smart: Use the background to confirm market regimes—e.g., go long during green (bull) phases above key support levels, or protect capital during red (bear) phases.
Why It’s Great:
Beginners: Simple background colors make market trends easy to spot.
Trend Traders: 50/150 SMA crossover with slope confirmation catches major market shifts.
Long-Term Investors: Persistent background ensures you stay in the trend without noise.
Created by Timothy Assi (Panic Drop), eToro’s elite investor. Test it, tweak it, and trade with confidence!

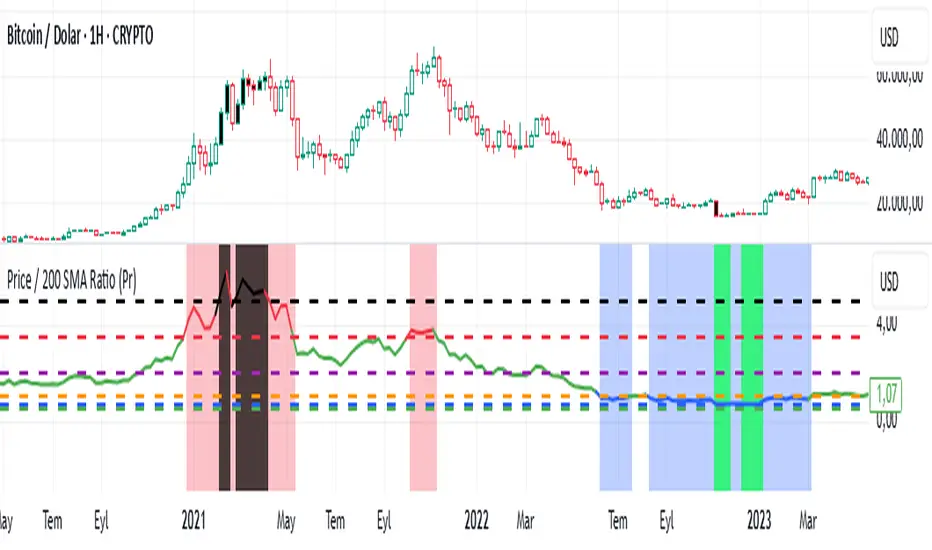
Price / 200 SMA Ratio (Pr)Price / 200 SMA Ratio (Pr) Indicator
The Price / 200 SMA Ratio (Pr) indicator is designed to help traders analyze the relationship between the current price and the 200-period Simple Moving Average (SMA). By calculating the ratio of the close price to the 200 SMA, the indicator provides a visual representation of how the price compares to the long-term trend, giving traders a clear view of potential overbought or oversold conditions.
How It Works:
Ratio Calculation:
The core of this indicator lies in the ratio between the current close price and the 200-period Simple Moving Average (SMA). The formula is straightforward:
Ratio = Close Price / 200 SMA
This ratio indicates whether the current price is above or below the long-term trend (the 200 SMA). A ratio greater than 1 means the price is above the 200 SMA, while a ratio below 1 suggests the price is below the 200 SMA.
Color-Coded Ratio Representation:
The ratio is displayed as a line on the chart with a color that changes dynamically based on the value of the ratio. The color-coding system helps quickly identify key levels:
Black: When the ratio is greater than 5, the price is significantly above the 200 SMA, indicating a highly overbought condition.
Red: When the ratio is greater than 3.5, it signals that the price is significantly above the long-term average but not in extreme territory.
Blue: When the ratio is less than 1, the price is below the 200 SMA, indicating that the market may be in an oversold condition.
Purple: When the ratio is below 0.7, it suggests an extremely oversold market, well below the long-term average.
Green: For values in between, the ratio is considered to be in a more neutral range, showing a balanced market position.
Horizontal Reference Lines:
To make the interpretation of the ratio easier, the indicator includes several reference lines plotted at key ratio levels. These lines help traders visualize specific price zones, giving them clear boundaries for potential trading decisions:
5 Zone (Black line): Marks an extremely high price level, indicating a highly overbought condition.
3.5 Zone (Red line): Represents the upper price zone, where prices are significantly higher than the 200 SMA.
2 Zone (Purple line): This line marks the mid-range of the ratio, providing a visual representation of the transition between overbought and oversold conditions.
1 Zone (Orange line): The 1.0 line is where the price equals the 200 SMA, indicating a balanced market. Prices above 1.0 are considered above average, and prices below 1.0 are below average.
0.7 Zone (Blue line): Represents a very low price level, suggesting an extremely oversold market.
Extra Low Zone (Green line): This line marks an even lower price level, indicating severe oversold conditions.
Background Coloring:
In addition to the ratio line and reference lines, the background color of the chart changes dynamically to provide additional context to the trader:
Red Background: When the ratio is greater than 3.5, the background becomes red, signaling an overbought market condition.
Blue Background: When the ratio is less than 1, the background turns blue, indicating a potential oversold market.
Black Background: If the ratio exceeds 5, the background will be black, signifying an extreme overbought condition.
Green Background: If the ratio drops below 0.7, the background turns green, highlighting an extremely oversold market.
Candle Coloring:
The indicator also changes the color of the individual price bars (candles) based on the ratio value:
Black Candles: When the ratio is greater than 5 or less than 0.7, the price bars are black to emphasize extreme conditions in the market.
White Candles: For all other values, the candles are white, representing a neutral market condition.
What This Indicator Tells You:
Overbought Conditions: When the ratio is significantly above 1 (especially greater than 3.5 or 5), it indicates that the price is far above the 200 SMA, suggesting that the market may be overbought and could experience a correction.
Oversold Conditions: When the ratio is significantly below 1 (especially below 0.7 or 0.5), it suggests that the price is far below the 200 SMA, indicating that the market may be oversold and could be due for a bounce.
Trend and Momentum: The ratio provides insight into the overall trend. If the ratio is consistently above 1, it means the price is generally in an uptrend, and if it’s below 1, it indicates a downtrend.
Why Use This Indicator?
The Price / 200 SMA Ratio indicator is a valuable tool for traders who want to gain insights into the strength or weakness of the price relative to the long-term trend (200 SMA). The color-coding system provides an easy-to-read visual cue, and the reference lines allow traders to identify key price levels where potential reversal or continuation could occur. It helps to spot areas of overbought or oversold conditions, making it ideal for traders looking to enter or exit positions based on extreme price movements.
By combining this indicator with other technical analysis tools, traders can enhance their strategy and make more informed decisions in the market.