Hucklekiwi Pip - HLHB Trend-Catcher SystemThe strategy was authored by Hucklekiwi Pip back in 2015 and is still being updated today. She says that the system was designed to simply catch short-term forex trends. At its heart, the system is a simple EMA crossover strategy with a couple of other indicators used for confirming entries.
Strategy Rules
See her original post here:
www.babypips.com
Be sure to check out the updates and tweaks over the years!
HOW TO USE
For full information on how to use this strategy and how to correctly set the exit time, see this post:
backtest-rookies.com
ADX

Linda Raschke's Holy GrailAnother script based on Linda Raschke's strategy with the same name from her book about swing trading.
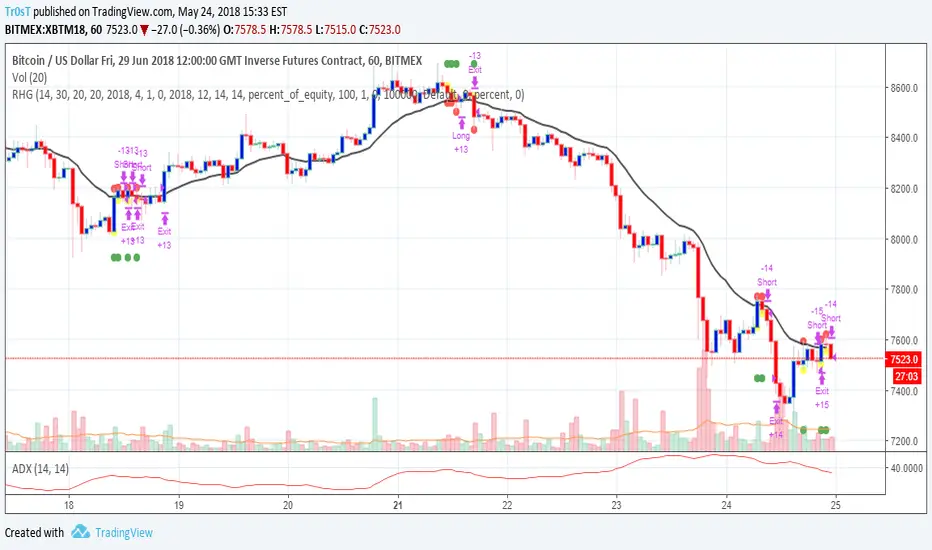
Range Action Verification Index (RAVI) Backtest The indicator represents the relative convergence/divergence of the moving
averages of the financial asset, increased a hundred times. It is based on
a different principle than the ADX. Chande suggests a 13-week SMA as the
basis for the indicator. It represents the quarterly (3 months = 65 working days)
sentiments of the market participants concerning prices. The short moving average
comprises 10% of the one and is rounded to seven.
You can change long to short in the Input Settings
WARNING:
- For purpose educate only
- This script to change bars colors.

Glory Hole with SMA + ADX - StrategyHere you get a script with the rules for "Glory Hole"-Strategy from Linda Raschke.
In Addition, I choose the SMA - not the EMA for this script.
MY RECOMMONDATION:
If you get a trade Signal, then set an sell- oder buy-order on the high or low. If the next bar doesn't touch into the trade, then delete your order.
Have fun and good look.

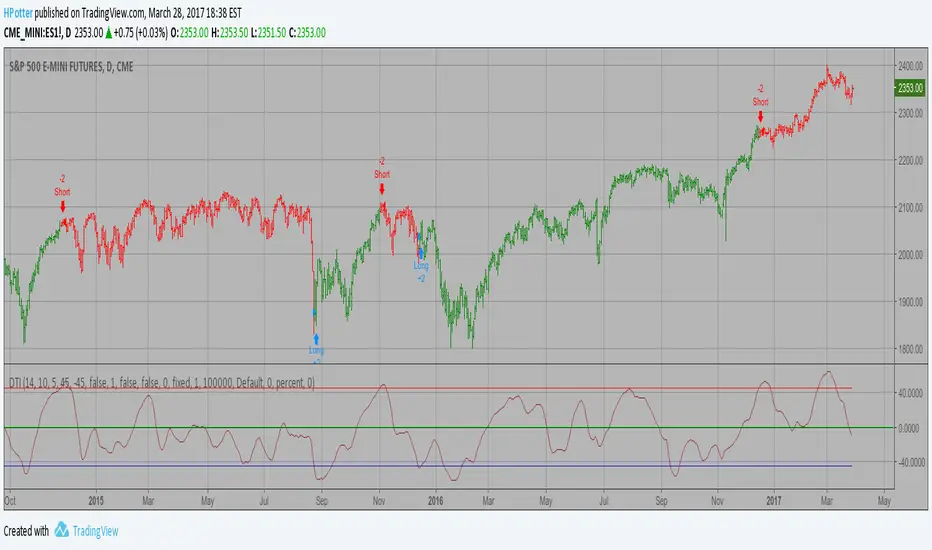
Directional Trend Index (DTI) This technique was described by William Blau in his book "Momentum,
Direction and Divergence" (1995). His book focuses on three key aspects
of trading: momentum, direction and divergence. Blau, who was an electrical
engineer before becoming a trader, thoroughly examines the relationship between
price and momentum in step-by-step examples. From this grounding, he then looks
at the deficiencies in other oscillators and introduces some innovative techniques,
including a fresh twist on Stochastics. On directional issues, he analyzes the
intricacies of ADX and offers a unique approach to help define trending and
non-trending periods.
Directional Trend Index is an indicator similar to DM+ developed by Welles Wilder.
The DM+ (a part of Directional Movement System which includes both DM+ and
DM- indicators) indicator helps determine if a security is "trending." William
Blau added to it a zeroline, relative to which the indicator is deemed positive or
negative. A stable uptrend is a period when the DTI value is positive and rising, a
downtrend when it is negative and falling.
You can change long to short in the Input Settings
Please, use it only for learning or paper trading. Do not for real trading
Forex Master v4.0 (EUR/USD Mean-Reversion Algorithm)DESCRIPTION
Forex Master v4.0 is a mean-reversion algorithm currently optimized for trading the EUR/USD pair on the 5M chart interval. All indicator inputs use the period's closing price and all trades are executed at the open of the period following the period where the trade signal was generated.
There are 3 main components that make up Forex Master v4.0:
I. Trend Filter
The algorithm uses a version of the ADX indicator as a trend filter to trade only in certain time periods where price is more likely to be range-bound (i.e., mean-reverting). This indicator is composed of a Fast ADX and a Slow ADX, both using the same look-back period of 50. However, the Fast ADX is smoothed with a 6-period EMA and the Slow ADX is smoothed with a 12-period EMA. When the Fast ADX is above the Slow ADX, the algorithm does not trade because this indicates that price is likelier to trend, which is bad for a mean-reversion system. Conversely, when the Fast ADX is below the Slow ADX, price is likelier to be ranging so this is the only time when the algorithm is allowed to trade.
II. Bollinger Bands
When allowed to trade by the Trend Filter, the algorithm uses the Bollinger Bands indicator to enter long and short positions. The Bolliger Bands indicator has a look-back period of 20 and a standard deviation of 1.5 for both upper and lower bands. When price crosses over the lower band, a Long Signal is generated and a long position is entered. When price crosses under the upper band, a Short Signal is generated and a short position is entered.
III. Money Management
Rule 1 - Each trade will use a limit order for a fixed quantity of 50,000 contracts (0.50 lot). The only exception is Rule
Rule 2 - Order pyramiding is enabled and up to 10 consecutive orders of the same signal can be executed (for example: 14 consecutive Long Signals are generated over 8 hours and the algorithm sends in 10 different buy orders at various prices for a total of 350,000 contracts).
Rule 3 - Every order will include a bracket with both TP and SL set at 50 pips (note: the algorithm only closes the current open position and does not enter the opposite trade once a TP or SL has been hit).
Rule 4 - When a new opposite trade signal is generated, the algorithm sends in a larger order to close the current open position as well as open a new one (for example: 14 consecutive Long Signals are generated over 8 hours and the algorithm sends in 10 different buy orders at various prices for a total of 350,000 contracts. A Short Signal is generated shortly after the 14th Long Signal. The algorithm then sends in a sell order for 400,000 contracts to close the 350,000 contracts long position and open a new short position of 50,000 contracts).

