Enhanced Candle Sticks [AlgoAlpha]🚀🌟 Introducing the Enhanced Candle Sticks by AlgoAlpha, a Pine Script tool designed to provide traders with an enhanced view of market dynamics through candlestick analysis. This script aims to visualise if price has hit the high or low of the candle first, aiding in back-testing, and to identify smaller trends using market structure.📊🔍
Key Features:
Timeframe Flexibility: Users can select their desired timeframe for analysis, offering a range of options from M15 to H12. This flexibility allows for detailed and specific timeframe analysis.
Micro Trend Identification: The script includes an option to enable 'MicroTrends', giving traders insights into smaller movements and trends within the larger market context.
Customizable Visuals: Traders can customize the colors of bullish and bearish candlesticks, enhancing visual clarity and personalizing the chart to their preferences.
State Tracking: The script tracks the 'state' of the market on lower timeframes to detect if the high or the low was formed first.
Warning System: When the selected timeframe does not match the chart timeframe, the script generates a warning, ensuring accurate analysis and preventing potential misinterpretations.
Usages:
Enhanced Back-testing: Users can now get a more accurate interpretation of the candlesticks by know if the high or the low came first (denoted with ⩚ or ⩛), especially in scenarios where the high and the low of the larger timeframe candle is touching both the take-profit and stop-loss levels.
Squeeze Analysis: Users can identify squeezes in price when the microtrend shows both an uptrend and a downtrend, possibly giving more insight into the market.
Lower Timeframe Market Structure Analysis: Microtrends form when the low of the candle is consecutively increasing and the high is consecutively falling, which means on a lower timeframe, price is forming higher lows or lower highs.
Basic Logic Explanation:
- The script starts by setting up the necessary parameters and importing the required library. Users can customize the timeframe, colors, and whether to enable micro trends and candlestick plotting.
- It then calculates the lower timeframe (1/12th of the current timeframe) for more detailed analysis. The `minutes` function helps in converting the selected timeframe into minutes.
- The script tracks new bars and calculates the highest and lowest values within an hour, using `ta.highestSince` and `ta.lowestSince`.
- It determines the market 'state' by checking if the current high is breaking the previous high and if the current low is breaking the previous low on lower timeframes to determine if the high or the low was formed first.
- The script uses the `plotchar` and `plotcandle` functions to visually represent these trends and states on the chart. This visual representation is key for quick and effective analysis.
Alerts:
Alerts can be set for microtrend formations:
This script is a valuable tool for traders looking to deepen their market analysis with enhanced candlestick visualization and micro trend tracking. 📈🔶💡
Algotrading

Standardized Median Proximity [AlgoAlpha]Introducing the Standardized Median Proximity by AlgoAlpha 🚀📊 – a dynamic tool designed to enhance your trading strategy by analyzing price fluctuations relative to the median value. This indicator is built to provide clear visual cues on the price deviation from its median, allowing for a nuanced understanding of market trends and potential reversals.
🔍 Key Features:
1. 📈 Median Tracking: At the core of this indicator is the calculation of the median price over a specified lookback period. By evaluating the current price against this median, the indicator provides a sense of whether the price is trending above or below its recent median value.
medianValue = ta.median(priceSource, lookbackLength)
2. 🌡️ Normalization of Price Deviation: The deviation of the price from the median is normalized using standard deviation, ensuring that the indicator's readings are consistent and comparable across different time frames and instruments.
standardDeviation = ta.stdev(priceDeviation, 45)
normalizedValue = priceDeviation / (standardDeviation + standardDeviation)
3. 📌 Boundary Calculations: The indicator sets upper and lower boundaries based on the normalized values, helping to identify overbought and oversold conditions.
upperBoundary = ta.ema(positiveValues, lookbackLength) + ta.stdev(positiveValues, lookbackLength) * stdDevMultiplier
lowerBoundary = ta.ema(negativeValues, lookbackLength) - ta.stdev(negativeValues, lookbackLength) * stdDevMultiplier
4. 🎨 Visual Appeal and Clarity: With carefully chosen colors, the plots provide an intuitive and clear representation of market states. Rising trends are indicated in a shade of green, while falling trends are shown in red.
5. 🚨 Alert Conditions: Stay ahead of market movements with customizable alerts for trend shifts and impulse signals, enabling timely decisions.
alertcondition(ta.crossover(normalizedValue, 0), "Bullish Trend Shift", "Median Proximity Crossover Zero Line")
🔧 How to Use:
- 🎯 Set your preferred lookback lengths and standard deviation multipliers to tailor the indicator to your trading style.
- 💹 Utilize the boundary plots to understand potential overbought or oversold conditions.
- 📈 Analyze the color-coded column plots for quick insights into the market's direction relative to the median.
- ⏰ Set alerts to notify you of significant trend changes or conditions that match your trading criteria.
Basic Logic Explained:
- The indicator first calculates the median of the selected price source over your chosen lookback period. This median serves as a baseline for measuring price deviation.
- It then standardizes this deviation by dividing it by the standard deviation of the price deviation over a 45-period lookback, creating a normalized value.
- Upper and lower boundaries are computed using the exponential moving average (EMA) and standard deviation of these normalized values, adjusted by your selected multiplier.
- Finally, color-coded plots provide a visual representation of these calculations, offering at-a-glance insights into market conditions.
Remember, while this tool offers valuable insights, it's crucial to use it as part of a comprehensive trading strategy, complemented by other analysis and indicators. Happy trading!
🚀

Median Proximity Percentile [AlgoAlpha]📊🚀 Introducing the "Median Proximity Percentile" by AlgoAlpha, a dynamic and sophisticated trading indicator designed to enhance your market analysis! This tool efficiently tracks median price proximity over a specified lookback period and finds it's percentile between 2 dynamic standard deviation bands, offering valuable insights for traders looking to make informed decisions.
🌟 Key Features:
Color-Coded Visuals: Easily interpret market trends with color-coded plots indicating bullish or bearish signals.
Flexibility: Customize the indicator with your preferred price source and lookback lengths to suit your trading strategy.
Advanced Alert System: Stay ahead with customizable alerts for key trend shifts and market conditions.
🔍 Deep Dive into the Code:
Choose your preferred price data source and define lookback lengths for median and EMA calculations. priceSource = input.source(close, "Source") and lookbackLength = input.int(21, minval = 1, title = "Lookback Length")
Calculate median value, price deviation, and normalized value to analyze market position relative to the median. medianValue = ta.median(priceSource, lookbackLength)
Determine upper and lower boundaries based on standard deviation and EMA. upperBoundary = ta.ema(positiveValues, lookbackLength) + ta.stdev(positiveValues, lookbackLength) * stdDevMultiplier
lowerBoundary = ta.ema(negativeValues, lookbackLength) - ta.stdev(negativeValues, lookbackLength) * stdDevMultiplier
Compute the percentile value to track market position within these boundaries. percentileValue = 100 * (normalizedValue - lowerBoundary)/(upperBoundary - lowerBoundary) - 50
Enhance your analysis with Hull Moving Average (HMA) for smoother trend identification. emaValue = ta.hma(percentileValue, emaLookbackLength)
Visualize trends with color-coded plots and characters for easy interpretation. plotColor = percentileValue > 0 ? colorUp : percentileValue < 0 ? colorDown : na
Set up advanced alerts to stay informed about significant market movements. // Alerts
alertcondition(ta.crossover(emaValue, 0), "Bullish Trend Shift", "Median Proximity Percentile Crossover Zero Line")
alertcondition(ta.crossunder(emaValue, 0), "Bearish Trend Shift", "Median Proximity Percentile Crossunder Zero Line")
alertcondition(ta.crossunder(emaValue,emaValue ) and emaValue > 90, "Bearish Reversal", "Median Proximity Percentile Bearish Reversal")
alertcondition(ta.crossunder(emaValue ,emaValue) and emaValue < -90, "Bullish Reversal", "Median Proximity Percentile Bullish Reversal")
🚨 Remember, the "Median Proximity Percentile " is a tool to aid your analysis. It’s essential to combine it with other analysis techniques and market understanding for best results. Happy trading! 📈📉

Momentum Bias Index [AlgoAlpha]Description:
The Momentum Bias Index by AlgoAlpha is designed to provide traders with a powerful tool for assessing market momentum bias. The indicator calculates the positive and negative bias of momentum to gauge which one is greater to determine the trend.
Key Features:
Comprehensive Momentum Analysis: The script aims to detect momentum-trend bias, typically when in an uptrend, the momentum oscillator will oscillate around the zero line but will have stronger positive values than negative values, similarly for a downtrend the momentum will have stronger negative values. This script aims to quantify this phenomenon.
Overlay Mode: Traders can choose to overlay the indicator on the price chart for a clear visual representation of market momentum.
Take-profit Signals: The indicator includes signals to lock in profits, they appear as labels in overlay mode and as crosses when overlay mode is off.
Impulse Boundary: The script includes an impulse boundary, the impulse boundary is a threshold to visualize significant spikes in momentum.
Standard Deviation Multiplier: Users can adjust the standard deviation multiplier to increase the noise tolerance of the impulse boundary.
Bias Length Control: Traders can customize the length for evaluating bias, enabling them to fine-tune the indicator according to their trading preferences. A higher length will give a longer-term bias in trend.

Squeeze & Release [AlgoAlpha]Introduction:
💡The Squeeze & Release by AlgoAlpha is an innovative tool designed to capture price volatility dynamics using a combination of EMA-based calculations and ATR principles. This script aims to provide traders with clear visual cues to spot potential market squeezes and release scenarios. Hence it is important to note that this indicator shows information on volatility, not direction.
Core Logic and Components:
🔶EMA Calculations: The script utilizes the Exponential Moving Average (EMA) in multiple ways to smooth out the data and provide indicator direction. There are specific lengths for the EMAs that users can modify as per their preference.
🔶ATR Dynamics: Average True Range (ATR) is a core component of the script. The differential between the smoothed ATR and its EMA is used to plot the main line. This differential, when represented as a percentage of the high-low range, provides insights into volatility.
🔶Squeeze and Release Detection: The script identifies and highlights squeeze and release scenarios based on the crossover and cross-under events between our main line and its smoothed version. Squeezes are potential setups where the market may be consolidating, and releases indicate a potential breakout or breakdown.
🔶Hyper Squeeze Detection: A unique feature that detects instances when the main line is rising consistently over a user-defined period. Hyper squeeze marks areas of extremely low volatility.
Visual Components:
The main line (ATR-based) changes color depending on its position relative to its EMA.
A middle line plotted at zero level which provides a quick visual cue about the main line's position. If the main line is above the zero level, it indicates that the price is squeezing on a longer time horizon, even if the indicator indicates a shorter-term release.
"𝓢" and "𝓡" characters are plotted to represent 'Squeeze' and 'Release' scenarios respectively.
Standard Deviation Bands are plotted to help users gauge the extremity and significance of the signal from the indicator, if the indicator is closer to either the upper or lower deviation bands, this means that statistically, the current value is considered to be more extreme and as it is further away from the mean where the indicator is oscillating at for the majority of the time. Thus indicating that the price has experienced an unusual amount or squeeze or release depending on the value of the indicator.
Usage Guidelines:
☝️Traders can use the script to:
Identify potential consolidation (squeeze) zones.
Gauge potential breakout or breakdown scenarios (release).
Fine-tune their entries and exits based on volatility.
Adjust the various lengths provided in the input for better customization based on individual trading styles and the asset being traded.

Alpha Schaff [AlgoAlpha]Description:
The Alpha Schaff indicator is a proprietary technical analysis tool that incorporates a modified version of the Schaff Trend Cycle (STC) to generate trading signals. The indicator is designed to identify potential overbought and oversold conditions in the market. It utilizes a combination of exponential moving averages (EMAs) and price volatility to generate trading signals. The plot of the indicator is derived from the opening price adjusted by a factor that depends on the Alpha Schaff value. A color scheme is used to indicate whether the current value is higher or lower than the previous value.
What is Alpha Schaff?:
Alpha Schaff is a technical indicator used in trading to identify potential trend reversals and confirm the strength of a current trend. It combines multiple moving averages and oscillators to generate buy and sell signals. Traders use Alpha Schaff to make informed decisions about entering or exiting positions based on its indications of trend momentum and market conditions.
Calculation:
The Alpha Schaff indicator calculates the difference between fast and slow EMAs based on the specified input lengths. It then measures the highest and lowest values of the difference over a defined sensitivity period. The indicator normalizes these values to a percentage scale to provide insights into the current market conditions.
How to use it?:
Monitor the color of the indicator line. A change in color indicates a potential trend reversal. For example, a switch from white to a purple color suggests a possible bullish trend, while a switch from a purple color to white indicates a potential bearish trend. Points of reversal can also be indicated by distinctive arrows pointing upwards or downward as well as visualized in bullish/bearish colors. The Distance between the indicator plot and the source can be interpreted as a measurement of price volatility. The script includes alert conditions that trigger when specific criteria are met. These alerts can notify users of potential buying or selling opportunities based on the indicator's signals.
Utility:
The Alpha Schaff is a trend-following indicator suitable for traders operating in trending markets. It offers clear and precise signals that provide valuable insights into bullish or bearish price movements. Additionally, this indicator stands out by incorporating distinctive arrows, indicating potential retracement points and allowing traders to anticipate mean reversion.
Originality:
The Alpha Schaff indicator, developed by AlgoAlpha introduces a proprietary modification to the Schaff Trend Cycle (STC) by incorporating multiple moving averages and oscillators. While the concept of the Schaff Trend Cycle exists, the specific implementation and combination of elements in the Alpha vSchaff indicator are unique to this tool. The inclusion of color schemes, arrow indicators, and volatility measurements sets it apart from other technical analysis indicators. Traders can benefit from its originality by utilizing its distinctive features to make more informed trading decisions in trending markets.

[Opening Range Breakout] S&R Strategy with Backtest (TSO) S&R Strategy with Backtest (TSO)
===========================================================================
===========================================================================
This indicator serves as a comprehensive full-cycle trading system, providing alerts at each stage of the trade, from opening to closure. The algorithm initiates by calculating the Opening/Pre-Market Price Range, waiting for a breakout to generate signals, and establishing TP (Take Profit and SL (Stop Loss) levels. The Opening/Pre-Market range, known for its robust support and resistance levels, is a key element. To filter out false breakouts and capture valid ones, the indicator incorporates a Smart Breakout feature, requiring confirmation through an initial breakout, a confirmation bounce, and a subsequent confirmation breakout. The indicator offers a variety of automated approaches for TP (Take-Profit) and SL (Stop-Loss) settings. These include leveraging opening range levels, both the most recent and historical S&R (Support and Resistance) levels, and an ATR (Average True Range) trailing stop-loss. This diverse set of tools ensure flexibility in tailoring TP (Take-Profit) and SL (Stop-Loss) parameters to different market conditions, contributing to a more adaptive and robust trading system. Additionally, a series of signal analysis tools, including candle bar analysis, divergence, and volume, enhance the precision of trading signals.
* Works with popular timeframes: 1M, 3M, 5M, 15M, 30M, 45M, 1H.
* Works best with Indices, Stocks, and Commodities, since there is pre-market price movement, which is used to obtain support and resistance price range.
* Every action of the trade is calculated on a confirmed closed candle bar state (barstate.isconfirmed), so the indicator will never repaint.
==============================================================
Indicator visual examples with various instruments:
---------------------------------------------------------------------------
Strategy Config: ORB_AAPL(NASDAQ)_15M
Example of Signal Cleanup confirmations via SMA and ATR. Take-Profit is calculated per optimal S&R (resistance) most recent levels.
---------------------------------------------------------------------------
Strategy Config: ORB_AMD(NASDAQ)_5M
Example of optimal S&R (resistance) level from previous day for Take-Profit 1 target, which gets hit.
---------------------------------------------------------------------------
Strategy Config: ORB_META(NASDAQ)_5M
Example of dynamic SL (Stop-Loss), which reduces the risk by moving to the new support level, which is at the same time is below the current price. Also Signal Cleanup confirmations via SMA, ATR and VWAP
---------------------------------------------------------------------------
Strategy Config: ORB_MSFT(NASDAQ)_15M
Example of automated ATR Trail Stop-Loss activation at no optimal S&R (support) feature.
---------------------------------------------------------------------------
Strategy Config: ORB_NFLX(NASDAQ)_3M
Example of a skipped LONG trade due to no optimal S&R (support) for Stop-Loss (can be seen per chart that it would be a loss trade). On another side, a SHORT SMA Confirmed trade hits all 3 profit targets.
---------------------------------------------------------------------------
Strategy Config: ORB_NVDA(NASDAQ)_15M
Example of no optimal support for SHORT Take-Profit targets, with ATR Trail Stop-Loss.
---------------------------------------------------------------------------
Strategy Config: ORB_SPY(AMEX)_15M
Example of several signal confirmations at the same time (SMA, VWAP, EWO) and S&R-TP-Entry-SL SL (Stop-Loss) system, which at trade open sets SL (Stop-Loss) per optimal S&R (since this is a LONG trade - support) and then moves to Entry at first take-profit.
===========================================================================
Trading open/close/TP/SL labels, plots and colors explanations:
---------------------------------------------------------------------------
>>> Opening/Pre-Market range: White dashed lines show opening range/pre-market levels with dotted white line extend along the Trading Schedule (if Trading Schedule is turned off - it will extend until next day).
>>> Smart Breakout: 1) Initial Breakout: "init_Brekout" | 2) Confirmation Bounce: "conf_Bounce" | 3) Confirmation Breakout: "conf_Breakout" (additional lables on chart can be hidden with only Confirmation Breakout shown).
>>> Additional S&R (Support and Resistance) lines: yellow - support, blue - resistance (can be hidden).
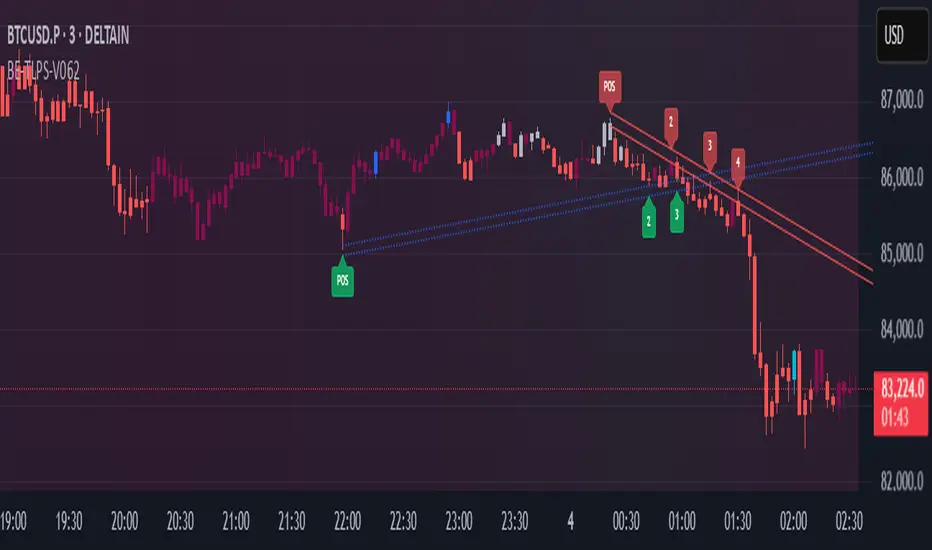
>>>>> LONG open: green "house" looking arrow below candle bar.
>>>>> SHORT open: red "house" looking arrow above candle bar.
>>>>> LONG/SHORT take-profit target: green/red circles (multi-profit > TP2/3/4/5 smaller circles).
>>>>> LONG/SHORT stop-loss target: green/red + crosses.
>>>>> LONG/SHORT take-profit hits: green/red diamonds.
>>>>> LONG/SHORT stop-loss hits: green/red X-crosses.
>>>>> LONG/SHORT EOD (End of Day | Intraday style) close (profitable trade): green/red squares.
>>>>> LONG/SHORT EOD (End of Day | Intraday style) close (loss trade): green/red PLUS(+)-crosses.
===========================================================================
STATS TABLE ///////////////////////////////////////////////////////////////
---------------------------------------------------------------------------
>>> Trading STATS table on the chart showing current trade direction, Last TP (Take-Profit) Taken, Current Trade PL (profit/loss in price difference from trade open to the very current state).
---------------------------------------------------------------------------
CUSTOM TRADING DATE RANGE /////////////////////////////////////////////////
---------------------------------------------------------------------------
>>>>> This feature can be used to manually set indicator trading range from and to a specific date and time. NOTE: This is not intended for a very long date range backtesting, utilize TradingView Strategy Tester for that.
* Use TradingView “Strategy Tester” to see Backtesting results
NOTE: If Strategy Tester does not show any results with Date Ranged fully unchecked, there may be an issue where a script opens a trade, but there is not enough TradingView power to set the Take-Profit and Stop-Loss and somehow an open trade gets stuck and never closes, so there are “no trades present”. In such case - manually check “Start”/“End” dates or use “Deep Backtesting” feature!
---------------------------------------------------------------------------
INTRADAY/TRADING SCHEDULE | ET (EASTERN TIMEZONE) ////////////////////////
---------------------------------------------------------------------------
>>> Trading Schedule - On/Off: This is where an Intraday Session or any custom session can be turned on and then scheduled.
>>>>> Trading Schedule - Time: Trade open Signals/Alerts time zone Hours. | NOTE: US Market Active Hours: 09:30 - 16:00 ET / Power Hour: 15:00 - 16:00 ET)
>>> Trading Schedule - EOD(End of Day) Close - On/Off: Close trade if still open by certain hour (set below).
>>>>> Trading Schedule - EOD(End of Day) Close - Hour (ET): US trading session closes at 4PM ET > 16:00.
Here is when the trade will close with EOD(End of Day) Close/Trading Cut Off Hour set to 16, which is end of US trading session:
1/3/5min > will close at 15:55pm ET
15min > will close at 15:45pm ET
30min > will close at 15:30pm ET
45min > will close at 15:45pm ET
60min > will close at 16:00pm ET
Here is when the trade will close with EOD(End of Day) Close/Trading Cut Off Hour set to 15, which is 1 hour before the end of US trading session (right before power hour starts):
1/3/5min > will close at 14:55pm ET
15min > will close at 14:45pm ET
30min > will close at 14:30pm ET
45min > will close at 14:45pm ET
60min > will close at 15:00pm ET
---------------------------------------------------------------------------
TRADE SIGNAL CONFIGURATION ////////////////////////////////////////////////
---------------------------------------------------------------------------
>>> Opening Range - Time Period (ET): Opening/Pre-Market Range time, which by default is set to US Session Pre-Market Range, can be customized to any time range as there are different market hours around the world and this setting can be customized to any time. Pre-Market Time/Price Range Hours(ET) | Pre-Market EU/Asia Hours: 4:00-9:30 ET | Pre-Market US (NY) Hours: 7:00-9:30 ET | Post-Market US Hours: 16:00-19:00 ET | First US Market Hour: 9:30-10:30 ET | Power Hour: 15:00-16:00)
>>> Opening Range - Levels Structure: determines how the price range is calculated, based on the highest/lowest price zones or based on the candle body bar.
>>> Opening Range - Breakout System: "Simple": bar close price has to simply break the opening range level | "Smart": After initial breakout (which is basically 'Simple' Breakout), a price come back is expected to the opening range level, a bounce, then a confirmation breakout with price closing ahead of the initial breakout.
>>>>> Opening Range - Smart Breakout: # of bars until Initial Breakout becomes invalid
>>>>> Opening Range - Smart Breakout: Bounce Settings, "Cross-Return" - LONG: Price has to cross down the initial breakout S&R, but never close below it; SHORT: Price has to cross up the initial breakout S&R, but then close above it; ||| "Cross-Close-Return" - LONG: At least 1 candle has to close below initial breakout S&R; SHORT: At least 1 candle has to close above initial breakout S&R.
>>>>> Alerts - Opening Range - Smart Breakout: Confirmation Bounce Alert. Trigger an alert at confirmation bounce. This is for live trading (especially scalping) Smart Breakout approach - to get ready to open the trade in the correct direction.
---------------------------------------------------------------------------
TAKE-PROFIT/STOP-LOSS CONFIGURATION ///////////////////////////////////////
---------------------------------------------------------------------------
>>> TP (Take-Profit) and SL (Stop-Loss): S&R Search - Left Bars: This setting is for calculating optimal S&R (Support and Resistance) levels (in combination with below - Right Bars) for S&R (Support and Resistance) TP (Take-Profit) levels calculations. NOTE: if at any point - there will be no available S&R (Support & Resistance) found for SL (Stop-Loss, 'S&R-Dynamic-SL' or 'S&R-Static-SL' setting, since both settings search for optimal SL (Stop-Loss) at trade open) or TP (Take-Profit, at any setting, since at trade open, an optimal TP (Take-Profit) level is searched) > SL (Stop-Loss) will automatically switch to trailing ATR-Trailing-SL and the trade will continue to run until it either hits ATR-Trailing-SL (Stop-Loss) or closes at EOD (End of Day).
>>> TP (Take-Profit) and SL (Stop-Loss): S&R Search - Right Bars: This setting is for calculating optimal S&R (Support and Resistance) levels (in combination with above - Left Bars) for S&R (Support and Resistance) TP (Take-Profit) levels calculations. NOTE: if at any point - there will be no available S&R (Support & Resistance) found for SL (Stop-Loss, 'S&R-Dynamic-SL' or 'S&R-Static-SL' setting, since both settings search for optimal SL (Stop-Loss) at trade open) or TP (Take-Profit, at any setting, since at trade open, an optimal TP (Take-Profit) level is searched) > SL (Stop-Loss) will automatically switch to trailing ATR-Trailing-SL and the trade will continue to run until it either hits ATR-Trailing-SL (Stop-Loss) or closes at EOD (End of Day).
>>> TP (Take-Profit) and SL (Stop-Loss): S&R Search - Custom Resolution: This is a custom timeframe setting specifically for S&R Search, it disregards current chart timeframe. This is great to use for scalping, for example: with main chart set to 1min and the custom timeframe set to 3min or 5min - there will be stronger support/resistance levels with more detailed price action.
>>> TP (Take-Profit) and SL (Stop-Loss): # of Bars (5000 max) to search back for optimal Support and Resistance levels: This is how many candles will be searched backwards for previous S&Rs (Support and Resistance) to find the optimal levels for TP (Take-Profit) and SL (Stop-Loss). NOTE: If SL (Stop-Loss) System is set to 'ATR-Trailing-SL' - this setting is only relevant for searching TP (Take-Profit) levels.
>>> TP (Take-Profit) and SL (Stop-Loss): At Trade Open - No S&R (Support and Resistance) found behavior: 'Skip Trade': If at trade open there are no S&R (Support and Resistance) levels for TP1 (Take-Profit 1) or SL (Stop-Loss) - trade is skipped. 'Open/ATR-Trailing-SL': If at trade open there are no S&R (Support and Resistance) levels for TP1 (Take-Profit 1) or SL (Stop-Loss), the trade will still be open with SL (Stop-Loss) set to 'ATR-Trailing-SL'.
>>> TP (Take-Profit) System: Pre-Market-Range-TP: All TP (Take-Profit) targets are calculated at trade open using the distance between Support and Resistance per Opening Pre-market Range and then divided by TP (Take-Profit) Divider, which can be set below; S&R-Current-Optimal-TP1: TP1 (Take-Profit) level is set per currently available S&R (Support & Resistance), if none available - historical S&R (Support & Resistance) levels will be searched, remaining TP (Take-Profit) targets (if selected, up to 5 # of TPs) are searched through most recent closest historical S&R (Support & Resistance) levels; S&R-Historic-Optimal-TP1: TP1 (Take-Profit) level is set per historically most recent closest available S&R (Support & Resistance) to the Entry price, remaining TP (Take-Profit) targets (if selected, up to 5 # of TPs) are searched through historical S&R (Support & Resistance) levels as well.
>>> TP (Take-Profit, Pre-Market-Range-TP) Divider #: This is for 'Pre-Market-Range-TP' setting only, where TP (Take-Profit) level is the distance between top/bottom levels of the opening range. It can be reduced by the divider #. (1 - full distance; 2 - 1/2 distance; 3 - 1/3 distance; etc.
>>> TP (Take-Profit) # of targets: It is wise to divide the trade into several profit targets. With this setting - up to 5 TP (Take-Profit) targets can be approached. The trade will be equally divided up by the selected # of TP (Take-Profit) targets.
>>> TP (Take-Profit) target(s) Consumed: Signal Bar consuming Take-Profits - trade signal bar is big enough to 'consume'/close ahead of the first TP setting > the signal can either be skipped, or all Take-Profit targets pushed ahead by average bar size).
>>> TP (Take-Profit) Offset - On/Off: This is a feature where TP (Take-Profit) target will be considered taken even if the price never crosses the target(s), but comes close enough (based on the offset amount). Set the offset amount below.
>>>>> TP (Take-Profit) Offset - Amount: Some Examples: (for SPY 0.1 would be $0.10 offset - if TP1 is $400 and price hits $399.90 > TP1 considered taken/signal shown/alert) | NOTE: For EURUSD, it is very different and if wrong will show TP1 immediately at trade open, typical good offset for EURUSD is: 0.0005 | Similar for BTCUSD, for example: 10 - $10 offset, if TP is $15,000 > $14,990.
>>> SL (Stop-Loss) System: 'Pre-Market-Range-SL': SL (Stop-Loss) is set to the opposite market range level from trade direction; 'S&R-Static-SL': SL (Stop-Loss) is set at trade open per optimal most recent S&R level and remains there until trade closes; 'S&R-Dynamic-SL': SL (Stop-Loss) is set at a trade open per optimal S&R (Support and Resistance) level from the most recent AND historical S&Rs (Support and Resistance), with every bar closed it will check if there are new S&Rs (Support and Resistance) levels, if these levels appear closer to the current price then current level - it will move SL (Stop-Loss) to that level, therefore reducing the risk; 'ATR-Trailing-SL': SL (Stop-Loss) is trail-following the ATR (Average True Range) line, NOTE: If at signal trigger, ATR will be against the trade direction - trade open signal will be skipped; 'S&R-TP-Entry-SL': SL (Stop-Loss) initially is set per S&R, then moves to Entry price at the very first TP (Take-Profit) hit and remains there until trade closes; 'S&R-TP-Trail-SL': SL (Stop-Loss) initially is set per S&R, then moves to Entry at TP1 (Take-Profit 1) hit, then keeps trailing per previously taken profit targets (TP2 taken, SL moves to TP1 | TP3 taken, SL moves to TP2 | TP4 taken, SL moves to TP3). NOTE: 'ATR-Trailing-SL' will not switch automatically if 'S&R-Dynamic-SL', S&R-TP-Entry-SL', 'S&R-TP-Trail-SL' system is selected, as already the most optimal SL (Stop-Loss) level is calculated - it will switch automatically only with 'S&R-Static-SL' system.
>>> SL (Stop-Loss) - On/Off: Without SL (Stop-Loss), unless EOD (End of Day) Close is turned on - there will be no SL (Stop-Loss) at all!
---------------------------------------------------------------------------
SIGNAL ANALYSIS AND CLEANUP ///////////////////////////////////////////////
---------------------------------------------------------------------------
>>> Signal Cleanup - Bar Color: Include Bar Color (bullish/bearish) confirmation, LONG signal will only be opened if signal bar is green/bullish, SHORT if red/bearish.
>>> Signal Cleanup - Bar Directional Structure: Skip opposite bar structure types signals (For example: bearish green hammer).
>>> Signal Cleanup - Bar Doji Skip: Skip doji (indecisive) candles signals.
>>> Signal Cleanup - EWO (Elliott Wave Oscillator): Include EWO (Elliott Wave Oscillator), LONG will only be opened if EWO is bullish / SHORT if EWO is bearish.
>>> Signal Cleanup - VWAP (Volume-Weighted Average Price): Include VWAP (Volume-Weighted Average Price), LONG will only be opened if price is above VWAP / SHORT if price is below VWAP.
>>> Signal Cleanup - MA (Moving Average) Confirmation: Include MA (Moving Average), LONG will only be opened if MA is bullish / SHORT if MA is bearish.
>>> Signal Cleanup - ATR (Average True Range): Include ATR (Average True Range) confirmation, LONG will only be opened if ATR is bullish / SHORT if ATR is bearish.
>>> Signal Cleanup - Divergence(RSI + MACD): Include Divergence (RSI + MACD ) confirmation, LONG will only be opened if Divergence is bullish / SHORT if Divergence is bearish.
>>> Signal Cleanup - Volume % Strength: Include Volume strength/percentage confirmation, LONG/SHORT will only be opened with strong Volume matching the signal direction | By default, strong Volume percentage is set to 150% and weak to 50%.
>>> Signal Cleanup - Volume Above Average: Include Volume Above Moving Average (Volume closing bar closes above volume moving average) confirmation, LONG/SHORT will only be opened with Volume above average - Volume closed bar color must match the closed price color (bullish/bearish direction) + Volume bar must be closed above volume MA line).
---------------------------------------------------------------------------
===========================================================================
||||||||||||||||||||||||||||||||||| *** ||||||||||||||||||||||||||||||||||| *** |||||||||||||||||||||||||||||||||||
||||||||||||||||||||||||||||||||||| *** ||||||||||||||||||||||||||||||||||| *** |||||||||||||||||||||||||||||||||||
TP System - VERY IMPORTANT INFO!
-------------------------------------------------------------------------------------------------------------------
"TP PERCENTAGE" - amount by which current trade/position needs to be reduced/partially closed/sold.
-------------------------------------------------------------------------------------------------------------------
TP System: Dynamic
"TP PERCENTAGE" - will always be the same amount (trade/position size divided by the # of take-profit(TP) targets) and percentage to be closed will always be of the ORIGINAL trade/position.
-------------------------------------------------------------------------------------------------------------------
TP System: Static
"TP PERCENTAGE" - will always be the same amount IF take-profit(TP) targets are hit 1-by-1 (TP1 > TP2 > TP3 > TP4 > TP5), otherwise it will vary and unless it is a 1st take-profit(TP1), the REMAINING trade/position size will always be smaller than original and therefore the percentage to be closed will always be of the REMAINING trade/position and NOT the original one!
-------------------------------------------------------------------------------------------------------------------
"TP PERCENTAGE" CheatSheet (these are the only percentages you may see)
-----------------------------------------------------------------------
TP PERCENTAGE---Close/Sell Amount-------------Example (trade size: 50 stocks)
20%-------------trade size * 0.2--------------50 * 0.2 = 10 stocks
25%-------------trade size * 0.25-------------50 * 0.25 = 12.5(~13) stocks
34%-------------trade size * 0.34-------------50 * 0.34 = 17 stocks
40%-------------trade size * 0.4--------------50 * 0.4 = 20 stocks
50%-------------trade size * 0.5--------------50 * 0.5 = 25 stocks
60%-------------trade size * 0.6--------------50 * 0.6 = 30 stocks
66%-------------trade size * 0.66-------------50 * 0.66 = 33 stocks
75%-------------trade size * 0.75-------------50 * 0.75 = 37.5(~38) stocks
80%-------------trade size * 0.8--------------50 * 0.8 = 40 stocks
100%------------trade size--------------------50 = 50 stocks
-----------------------------------------------------------------------
If for any reason a portion of the current/remaining trade closed at such occurrence was slightly wrong, it is not an issue. Such occurrences are rare and with slight difference in partial TP closed is not significant to overall performance of our algorithms.
||||||||||||||||||||||||||||||||||| *** ||||||||||||||||||||||||||||||||||| *** |||||||||||||||||||||||||||||||||||
||||||||||||||||||||||||||||||||||| *** ||||||||||||||||||||||||||||||||||| *** |||||||||||||||||||||||||||||||||||
===========================================================================
Alert Settings (you don’t have to touch this section unless you will be using TradingView alerts through a Webhook to use with trading bot)
---------------------------------------------------------------------------
Here is how a LONG OPEN alert looks like.
NOTE: Each label , , etc. is customizable, you can change the text of it within indicator Input settings.
ALERT >>>>>>>>>>>>>>>>>>>>>>>>>>>>>>>>>>>>>>>>>>>>>>>
COIN: BTCUSD
TIMEFRAME: 15M
LONG: OPEN
ENTRY: 20000
TP1: 20500
TP2: 21000
TP3: 21500
TP4: 22500
TP5: 23500
SL: 19000
Leverage: 0
---------------------------------------------------------------------------
Here is how a TP1 alert will look with 5 TPs breakdown of the trade.
NOTE1: Next to TP1 taken it will show at which price it was triggered.
NOTE2: Next to "TP Percentage" it shows how much of the CURRENT/ACTIVE/REMAINING trade needs to be closed.
NOTE2: If TP2/3/4/5 comes before TP1 - the alert will tell you exactly how many percent of the trade needs to be closed!
ALERT >>>>>>>>>>>>>>>>>>>>>>>>>>>>>>>>>>>>>>>>>>>>>>>
COIN: BTCUSD
TIMEFRAME: 15M
LONG: TP1
TP1: 20500
TP Percentage: 20%
---------------------------------------------------------------------------
Here is how an alert will look for LONG - STOP-LOSS.
ALERT >>>>>>>>>>>>>>>>>>>>>>>>>>>>>>>>>>>>>>>>>>>>>>>
COIN: BTCUSD
TIMEFRAME: 15M
ENTRY: 20000
LONG: SL
SL: 19000
---------------------------------------------------------------------------
Here is how an alert will look for LONG - EOD (End of Day) In Profit close.
ALERT >>>>>>>>>>>>>>>>>>>>>>>>>>>>>>>>>>>>>>>>>>>>>>>
COIN: BTCUSD
TIMEFRAME: 15M
LONG: EOD-Close (profit)
ENTRY: 20000
EOD-Close: 21900
===========================================================================
Adding Alerts in TradngView
---------------------------------------------------------------------------
-Add indicator to chart and make sure the correct strategy is configured (check Backtesting results)
-Right-click anywhere on the TradingView chart
-Click on Add alert
-Condition: Select this indicator by it’s name
-Immediately below, change it to "alert() function calls only", as other wise there will be 2 alerts for every alert!
-Expiration: Open-ended (that may require higher tier TradingView account, otherwise the alert will need to be occasionally re-triggered)
-Alert name: Whatever you desire
-Hit “Create”
-Note: If you change ANY Settings within the indicator – you must DELETE the current alert and create a new one per steps above, otherwise it will continue triggering alerts per old Settings!
===========================================================================
If you have any questions or issues with the indicator, please message me directly via TradingView.
---------------------------------------------------------------------------
Good Luck! (NOTE: Trading is very risky, past performance is not necessarily indicative of future results, so please trade responsibly!)
---------------------------------------------------------------------------
NOTE: There seems to be a strange glitch when strategy is running live, it will show "double-take" take-profits labels on the chart. This is not affecting the script logic and backtesting results, if you simply change the timeframe real quick to something else then back - it will no longer show the duplicate orders... this must be some sort of a glitch as every alert was thoroughly tested to make sure everything is working!

Session Breakout Scalper Trading BotHi Traders !
Introduction:
I have recently been exploring the world of automated algorithmic trading (as I prefer more objective trading strategies over subjective technical analysis (TA)) and would like to share one of my automation compatible (PineConnecter compatible) scripts “Session Breakout Scalper”.
The strategy is really simple and is based on time conditional breakouts although has more ”relatively” advanced optional features such as the regime indicators (Regime Filters) that attempt to filter out noise by adding more confluence states and the ATR multiple SL that takes into account volatility to mitigate the down side risk of the trade.
What is Algorthmic Trading:
Firstly what is algorithmic trading? Algorithmic trading also known as algo-trading, is a method of using computer programs (in this case pine script) to execute trades based on predetermined rules and instructions (this trading strategy). It's like having a robot trader who follows a strict set of commands to buy and sell assets automatically, without any human intervention.
Important Note:
For Algorithmic trading the strategy will require you having an essential TV subscription at the minimum (so that you can set alerts) plus a PineConnecter subscription (scroll down to the .”How does the strategy send signals” headings to read more)
The Strategy Explained:
Is the Time input true ? (this can be changed by toggling times under the “TRADE MEDIAN TIMES” group for user inputs).
Given the above is true the strategy waits x bars after the session and then calculates the highest high (HH) to lowest low (LL) range. For this box to form, the user defined amount of bars must print after the session. The box is symmetrical meaning the HH and LL are calculated over a lookback that is equal to the sum of user defined bars before and after the session (+ 1).
The Strategy then simultaneously defines the HH as the buy level (green line) and the LL as the sell level (red line). note the strategy will set stop orders at these levels respectively.
Enter a buy if price action crosses above the HH, and then cancel the sell order type (The opposite is true for a stop order).
If the momentum based regime filters are true the strategy will check for the regime / regimes to be true, if the regime if false the strategy will exit the current trade, as the regime filter has predicted a slowing / reversal of momentum.
The image below shows the strategy executing these trading rules ( Regime filters, "Trades on chart", "Signal & Label" and "Quantity" have been omitted. "Strategy label plots" has been switched to true)
Other Strategy Rules:
If a new session (time session which is user defined) is true (blue vertical line) and the strategy is currently still in a trade it will exit that trade immediately.
It is possible to also set a range of percentage gain per day that the strategy will try to acquire, if at any point the strategy’s profit is within the percentage range then the position / trade will be exited immediately (This can be changed in the “PERCENT DAY GAIN” group for user inputs)
Stops and Targets:
The strategy has either static (fixed) or variable SL options. TP however is only static. The “STRAT TP & TP” group of user inputs is responsible for the SL and TP values (quoted in pips). Note once the ATR stop is set to true the SL values in the above group no longer have any affect on the SL as expected.
What are the Regime Filters:
The Larry Williams Large Trade Index (LWLTI): The Larry Williams Large Trade Index (LWTI) is a momentum-based technical indicator developed by iconic trader Larry Williams. It identifies potential entries and exits for trades by gauging market sentiment, particularly the buying and selling pressure from large market players. Here's a breakdown of the LWTI:
LWLTI components and their interpretation:
Oscillator: It oscillates between 0 and 100, with 50 acting as the neutral line.
Sentiment Meter: Values above 75 suggest a bearish market dominated by large selling, while readings below 25 indicate a bullish market with strong buying from large players.
Trend Confirmation: Crossing above 75 during an uptrend and below 25 during a downtrend confirms the trend's continuation.
The Andean Oscillator (AO) : The Andean Oscillator is a trend and momentum based indicator designed to measure the degree of variations within individual uptrends and downtrends in the prices.
Regime Filter States:
In trading, a regime filter is a tool used to identify the current state or "regime" of the market.
These Regime filters are integrated within the trading strategy to attempt to lower risk (equity volatility and/or draw down). The regime filters have different states for each market order type (buy and sell). When the regime filters are set to true, if these regime states fail to be true the trade is exited immediately.
For Buy Trades:
LWLTI positive momentum state: Quotient of the lagged trailing difference and the ATR > 50
AO positive momentum state: Bull line > Bear line (signal line is omitted)
For Sell Trades:
LWLTI negative momentum stat: Quotient of the lagged trailing difference and the ATR < 50
AO negative momentum state: Bull line < Bear line (signal line is omitted)
How does the Strategy Send Signals:
The strategy triggers a TV alert (you will neet to set a alert first), TV then sends a HTTP request to the automation software (PineConnecter) which receives the request and then communicates to an MT4/5 EA to automate the trading strategy.
For the strategy to send signals you must have the following
At least a TV essential subscription
This Script added to your chart
A PineConnecter account, which is paid and not free. This will provide you with the expert advisor that executes trades based on these strategies signals.
For more detailed information on the automation process I would recommend you read the PineConnecter documentation and FAQ page.
Dashboard:
This Dashboard (top right by defualt) lists some simple trading statistics and also shows when a trade is live.
Important Notice:
- USE THIS STRATEGY AT YOUR OWN RISK AND ALWAYS DO YOUR OWN RESEARCH & MANUAL BACKTESTING !
- THE STRATEGY WILL NOT EXHIBIT THE BACKTEST PERFORMANCE SEEN BELOW IN ALL MARKETS !

Bollinger Bands Percentile + Stdev Channels (BBPct) [AlgoAlpha]Description:
The "Bollinger Bands Percentile (BBPct) + STD Channels" mean reversion indicator, developed by AlgoApha, is a technical analysis tool designed to analyze price positions using Bollinger Bands and Standard Deviation Channels (STDC). The combination of these two indicators reinforces a stronger reversal signal. BBPct calculates the percentile rank of the price's standard deviation relative to a specified lookback period. Standard deviation channels operate by utilizing a moving average as the central line, with upper and lower lines equidistant from the average based on the market's volatility, helping to identify potential price boundaries and deviations.
How it Works:
The BBPct indicator utilizes Bollinger Bands, which consist of a moving average (basis) and upper and lower bands based on a specified standard deviation multiplier. By default, it uses a 20-period moving average and a standard deviation multiplier of 2. The upper band is calculated by adding the basis to the standard deviation multiplied by the multiplier, while the lower band is calculated by subtracting the same value. The BBPct indicator calculates the position of the current price between the lower and upper Bollinger Bands as a percentile value. It determines this position by comparing the price's distance from the lower band to the overall range between the upper and lower bands. A value of 0 indicates that the price is at the lower band, while a value of 100 indicates that the price is at the upper band. The indicator also includes an optional Bollinger Band standard deviation percentage (%Stdev) histogram, representing the deviation of the current price from the moving average as a percentage of the price itself.
Standard deviation channels, also known as volatility channels, aid in identifying potential buying and selling opportunities while minimizing unfavorable trades. These channels are constructed by two lines that run parallel to a moving average. The separation between these lines is determined by the market's volatility, represented by standard deviation. By designating upper and lower channel lines, the channels demarcate the borders between typical and atypical price movements. Consequently, when the market's price falls below the lower channel line, it suggests undervaluation, whereas prices surpassing the upper channel line indicate overvaluation.
Signals
The chart displays potential reversal points through the use of red and green arrows. A red arrow indicates a potential bearish retracement, signaling a possible downward movement, while a green arrow represents a potential pullback to the positive, suggesting a potential upward movement. These signals are generated only when both the BBPct (Bollinger Bands Percentage) and the STDC (Standard Deviation Channel) indicators align with bullish or bearish conditions. Consequently, traders might consider opening long positions when the green arrow appears and short positions when the red arrow is plotted.
Usage:
This indicator can be utilized by traders and investors to effectively identify pullbacks, reversals, and mean regression, thereby enhancing their trading opportunities. Notably, extreme values of the BBPct, such as below -5 or above 105, indicate oversold or overbought conditions, respectively. Moreover, the presence of extreme STDC zones occurs when prices fall below the lower channel line or cross above the upper channel line. Traders can leverage this information as a mean reversion tool by identifying instances of peak overbought and oversold values. These distinctive characteristics facilitate the identification of potential entry and exit points, thus augmenting trading decisions and enhancing market analysis.
The indicator's parameters, such as the length of the moving average, the data source, and the standard deviation multiplier, can be customized to align with individual trading strategies and preferences.
Originality:
The BBPct + STDC indicator, developed by AlgoAlpha, is an original implementation that combines the calculation of Bollinger Bands, percentile ranking, the %Stdev histogram and the STDC. While it shares some similarities with the Bollinger Bands %B indicator, the BBPct indicator introduces additional elements and customization options tailored to AlgoAlpha's methodology. The script is released under the Mozilla Public License 2.0, granting users the freedom to utilize and modify it while adhering to the license terms.

Directional Bias [AlgoAlpha]The Directional Bias indicator is a premium script expertly crafted to enhance market trend visualization on trading charts. This sophisticated tool is designed to intuitively indicate the market's directional bias, aiding traders in making informed decisions on lower time frames.
Highlighted Features:
Intuitive Trend Visualization: The script employs a color-coded system for candles, simplifying the process of trend identification
Customizable Aesthetics: Users have the option to personalize the visual elements, including candle colors, to suit their preferences and enhance chart readability.
Advanced Logic: The script is built on a proprietary algorithm that analyzes candlestick patterns to determine the current trend direction.
Key Benefits:
Enhanced Decision Making: By offering a clear depiction of the market's directional bias, the indicator assists traders in making more informed entry and exit decisions, particularly suited for quick decision-making on lower timeframes.
Adaptability to Market Conditions: The script dynamically adjusts to changing market conditions, providing relevant and timely indications of trend changes or continuations.
Versatile Application: Suitable for various trading styles, the indicator can be effectively used in day trading, scalping, or even in longer-term trading strategies, depending on the timeframe selected.
Summary:
The "Directional Bias" indicator stands out as a vital tool for traders focusing on lower timeframes, offering an intuitive, customizable, and dynamic approach to trend visualization. Its advanced proprietary logic and user-friendly interface make it a valuable asset in a trader's toolkit, enhancing the ability to quickly interpret and react to market movements.

Gorb WallIntroduction:
Gorb Wall is a trading tool that offers a unique approach to market trend analysis. It extends the capabilities of the Gorb Algo indicator by presenting a multi-ticker, multi-timeframe dashboard, enabling traders to capture crucial market movements across various financial instruments without flipping through charts.
Overview:
Multi-Ticker Analysis: Monitor and analyze multiple financial instruments simultaneously.
Customizable Timeframes: Tailor the script to various timeframes to suit your trading strategy.
Gorb Algo Market Trend: An algorithm that adapts to market conditions, providing insights into trend changes.
User-Friendly Dashboard: Easily configure and customize the dashboard placement on your chart.
Color-Coded Trend Indicators: Visual cues to quickly assess bullish or bearish trends.
Optimized for Performance: Efficiently coded to ensure smooth running on TradingView without overloading resources.
How Gorb Wall Works:
The script utilizes Gorb Algo's market trend algorithm to process price and volume data across selected tickers and timeframes.
It applies a complex calculation to identify trends, using a combination of volatility analysis, momentum measurements, and trend strength indicators.
The output is a simplified visual representation on the dashboard, where colored circles indicate the trend direction, providing an at-a-glance market overview.
Unique Features:
Proprietary Algorithm: The heart of Gorb Wall lies in its unique Gorb Algo Market Trend algorithm. Unlike standard trend-following indicators, this proprietary algorithm integrates multiple technical analysis concepts (e.g., moving averages, volume data, price action, and oscillators) to provide a more comprehensive market trend analysis.
Multi-Dimensional Analysis: The script analyzes market trends by simultaneously processing data across multiple tickers and timeframes, offering a broader view of market movements than traditional single-ticker indicators.
We recommend exploring & choosing which tickers/timeframes best suits your needs and style of trading, and use that to combine with our suite of indicators.
Settings:
All skill-level friendly presets, easy to enable features with one-click
Dashboard Placement: Choose from top/bottom left/right for dashboard positioning.
Trend Speed Mode: Select the algorithm speed - Fast, Medium, Slow, Slowest.
Bullish/Bearish Trend Colors: Customize colors for trend indicators.
Additional Tickers: Input options for monitoring multiple financial instruments.
Timeframe Selection: Choose from a range of timeframes for each ticker.
How to Use
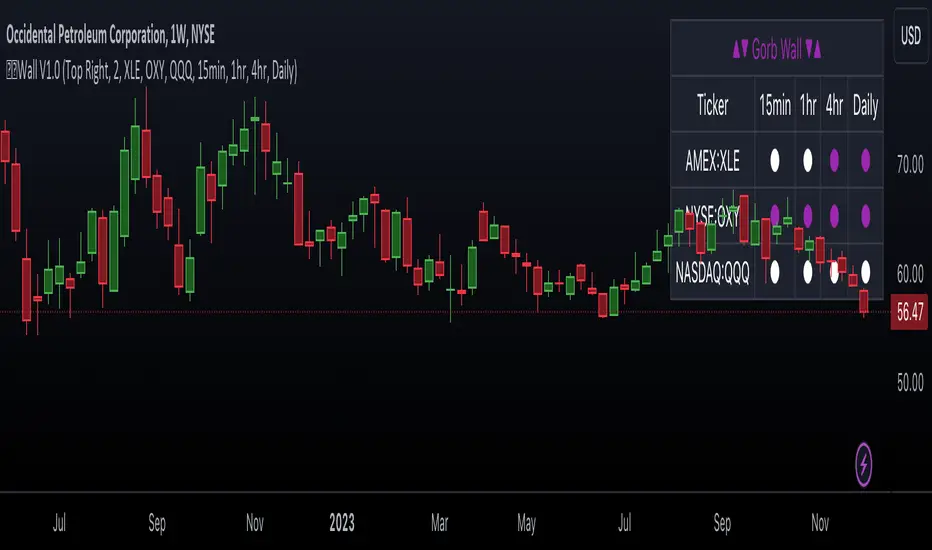
In the image below, we can see a basic example of how this indicator functions.
The dashboard displays up to three different tickers per the user's choice, with 4 different timeframes the user can choose. It that runs the algorithm line on the specified ticker & timeframe and plots a colored circle that identifies that tickers trend on the specified timeframes.
There are two colors, white for bullish trend and purple for bearish trend. These are the two consistent colors across our suit of indicators to help simplify trading by using simple color matching for confluence. Below is a continued breakdown on using this indicator:
Dynamic Trend Visualization in Real-Time Updates
The dashboard dynamically updates trend colors (white for bullish, purple for bearish) based on real-time market data, offering immediate insights into market sentiment. The next three images below these the live change in data as price action begins developing over multiple timeframes.
In the image above, we are on the 5min AAPL chart, we have SPY, QQQ, and VIX as our tickers on the dashboard with 1min, 2min, 3min, and 10min timeframes chosen. We begin to see VIX flip bullish, which can usually mean down side for indices.
We then see as AAPL's price begins to slow and reverse, we see SPY's trend following on the smaller timeframes first with VIX still leading the way indicating possible bearish change.
In the image above, we can see that price dips down and SPY & QQQ market trends have flipped bearish on all timeframes, while VIX continues to be bullish(validating the downwards price action)
Customizable Settings
Users can adjust settings such as dashboard placement, trend speed mode, and color themes to suit individual trading styles.
In the image below, we can see the dashboard placement setting offers four different locations the user can move the dashboard. Just like in Gorb Algo , the user can choose which trendline speed they want to use to best fit their trading strategy.
In the image below, we can see the "bullish trend" & "bearish trend" colors setting. These colors by default match the rest of our suite of indicators, white is bullish and purple is bearish. Users can change these color settings to meet their preferences.
In the image below, we can see there are three market ticker options that the user can change. This allows users to monitor their favorite tickers across or easily flip through multiple tickers in order to gauge their current market trends without having to change their chart
In the image below, we can see the 4 timeframes that are on the dashboard. The user has the ability to change each of those four, to whatever timeframe best suits their trading needs. There are 12 different timeframe options to choose from.
Quick Dashboard Review
Using color-coded trend detection, this quickly gauges market trends and provides a visual to easily identify these changes in real-time across multiple timeframes. When a circle changes color, this means that price has flipped that direction, causing a change in the Gorb Algo market trendline. As stated above, white is for bullish trend and purple is for bearish trend, but these colors can be changed to fit the users trading strategy and style. Each timeframe the user chooses will be updated in real-time, including the higher time frames like the daily & weekly. They have been modified to pull data a same speed the lower timeframes are.
This helps provide quick visual identification of real market trend changes as price action develops. It is best used in conjunction with other forms of technical analysis for a holistic trading approach.
Conclusion:
This indicator is designed to streamline market trend analysis, offering traders an innovative, efficient, and easy-to-use tool for making informed trading decisions. This tool complements our suite of indicators, providing unique market insights that are not typically available in traditional open-source scripts.
How to get access:
You can see the Author's instructions to get access to this indicator
RISK DISCLAIMER
All content, tools, scripts & education provided by Gorb Algo are for informational & educational purposes only. Trading is risky and most lose their money, past performance does not guarantee future results.
Gorb DNAIntroduction:
Gorb DNA is a versatile indicator using classic technical analysis components such as moving averages, stochastic oscillator, and histogram blending call/put flow analysis with our proprietary DNA algorithm. This indicator is designed to provide traders with useful market direction, volume, and momentum change visual cues.
Overview:
The Gorb DNA Indicator isn't just another momentum tool; it's a complex integration of innovative market analysis techniques.
By combining moving averages, stochastic oscillator, with proprietary algorithms, this indicator offers a multi-layered view of market trends, by merging call/put flow analysis with traditional market flow assessment.
This is designed for all kinds of traders, using a simple method to deliver visual changes in flow, volume, and momentum.
Core Features: Call/Put Flow & DNA
Call/Put Flow Analysis: This component examines the strength of market buying and selling pressures. It analyzes call (buying) and put (selling) flows using price range movements, providing insights smoothed over a defined period for analysis of market sentiment.
DNA Algorithm: A central feature of this indicator, the DNA algorithm utilizes a specialized moving average and oscillator technique to discern market trends. It presents an innovative approach, calculating the difference between bullish and bearish indicators to offer a detailed analysis of market momentum.
Visualization and Color Coding: The indicator employs a color-coded system for ease of interpretation, with distinct colors indicating different market conditions: white for upward/bullish movement and purple for downward/bearish movement. This feature translating complex data into a visual format that is simple to understand.
How Call/Put Flow Works:
Moving averages are used with volume and candlestick highs/lows over a specific range to help determine the overall flow. It then plots a colored line area that looks like a colored wave using just two colors to provide traders with a visual of the current market flow. This can help traders identify changes in sentiment with simple color cues.
How DNA Works:
A stochastic oscillator is used to measure the current price level relative to its price over a specific range period to analyze the momentum for the two DNA strands. Additionally moving averages are used to confirm trend and identify any divergences relative to the momentum. This is then plotted as two lines(DNA Strands) following the same color scheme as Call/Put Flow. When momentum is picking up in a specific direction, the lines will change colors and cross each other, this gives a visual of momentum now being fully on one side until it starts to change colors and flip that direction.
Custom Algorithm Elements:
Gorb DNA isn't just common tools combined into one indicator. It includes proprietary algorithmic elements tailored to enhance technical analysis and timing. These are the reasons what set this indicator apart from common momentum, sentiment, and volume methods.
We recommend experimenting with these features to choose what best suits your trading style.
Settings:
All skill-level friendly presets, easy to enable features with one-click
Call Flow: allows the user to plot a colored area that looks like waves showing increases/decreases in bullish volume (not to be followed blindly)
Put Flow: allows the user to plot a colored area that looks like waves showing increases/decreases in bearish volume (not to be followed blindly)
DNA Strand 1: allows the user to plot one of the algorithm lines to visualize momentum direction (not to be followed blindly)
DNA Strand 2: allows the user to plot one of the algorithm lines to visualize momentum direction (not to be followed blindly)
DNA Strength: allows the user to a histogram displaying momentum volume bars in the background
Flow Threshold: allows users to plot a dotted line to identify when call/put flow is now above average flow range
All colors are changeable for the user to customize to their liking
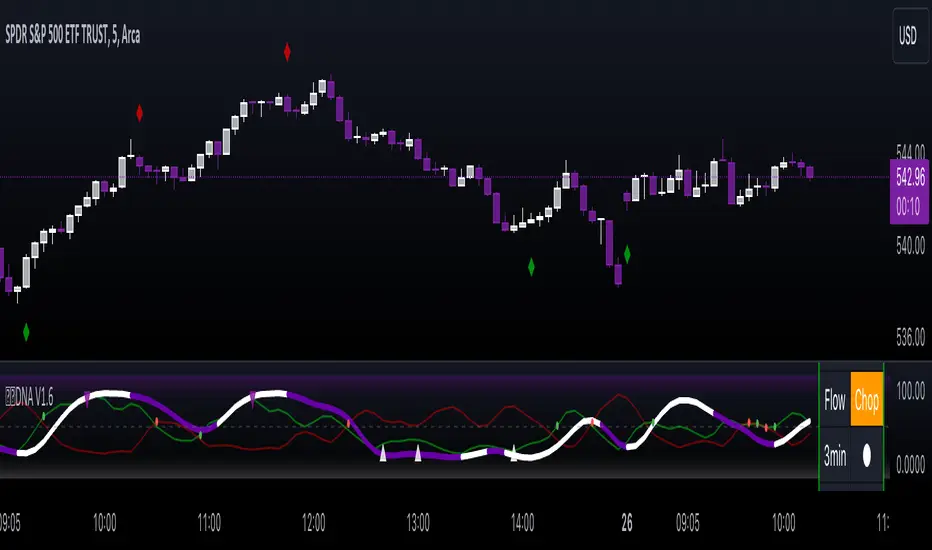
Call/Put Flow & DNA Demonstration
In the image below, we can see a basic illustration of how these core features function.
As stated above, call/put flow carefully monitors changes in moving averages, volume, and price action. If the market sentiment is shifting one direction, the call/put flow will plot those changes. If market is bullish, call flow should rise and put flow should decrease. The same goes for the opposite if the market is bearish.
As is the same for the DNA strands, if markets momentum is becoming bullish, the lines will change color and then cross to signify a change in momentum and the call flow in the background should match this change. This creates two layers of confluence in an easy understandable visual method.
Using Call/Put Flow
In the image below, we disabled everything but call flow to demonstrate usage.
On the left side of the image, you can see call flow matched price increase, then started to decline. This created a flow divergence, identifying a possible change in price action coming. This happened once flow crossed back below the threshold line and price then beginning to move lower. On the right side of the image, you can see call flow rising and price increasing. This is a good confluence showing there is bullish sentiment building in the market.
In this next image, we disabled everything but put flow to demonstrate usage.
The left side shows a put flow divergence. Put flow is slowly rising just like price is, this can help a trader identify a possible shift in sentiment coming. And on the right side, we have put flow rising above the threshold line and price beginning to decrease. Now we have confluence of bearish sentiment building in the market.
The image below shows only call & put flow enabled, to display what the above two images combined look like.
As you can see in the image above, these flow visuals help identify the underlying market sentiment. And when they cross, it leads to a change in price action in the direction of the sentiment over the threshold line.
Using DNA Strands
The image below has just DNA strands enabled to demonstrate usage.
On the left is a box highlighting bearish momentum cross. In the circles is the change in momentum shifting from bullish to bearish. The move gets stronger as the DNA strands get closer to cross over signifying strength in the move. On the right side is a box highlighting a bullish momentum cross. The circles again, show the change from bearish to bullish momentum. Like previously said, the move gets stronger as the DNA strands get closer to crossing over, signifying strength in that direction.
The next image shows call/put flow and DNA strands enabled for a full complete picture.
The circles labeled (1) are showing the change in momentum from bullish to bearish. Circle (2) shows call flow decreasing and put flow rising above calls. Finally the arrow points to the DNA strands crossing over and put flow rising above the threshold line. This is 3 levels of easy visual confluence showing a change in sentiment, volume, and momentum to the downside.
The next image will be showing the bullish side with call/put flow and DNA strands enabled.
The circles that are labeled (1), show the visual change in momentum on the DNA strands from bearish to bullish. Circle (2) is the crossing of call flow over put flow and the arrow points to the DNA strands crossing over and call flow above the threshold line. Three simple to use visual confluences to identify change in sentiment, volume, and momentum to the upside.
Conclusion:
Our goal is to provide a unique, yet simple approach to market sentiment & momentum analysis. It's a tool developed for traders seeking user-friendly and easy to use tools that provide easy visual insights of market dynamics. We believe in simplicity, effectiveness, and creating tools to support decision making for all traders.
How to get access:
You can see the Author's instructions to get access to this indicator
RISK DISCLAIMER
All content, tools, scripts & education provided by Gorb Algo are for informational & educational purposes only. Trading is risky and most lose their money, past performance does not guarantee future results.
Gorb AlgoIntroduction:
Gorb Algo is an all-in-one trading indicator made up of classic technical analysis components such as moving averages, relative strength index, stochastic oscillator, and pivot points blended together to create a synergistic algorithm. Focused on providing useful signals & trading tool overlays to meet all trader's technical analysis needs. Each feature included can be changed to meet each traders strategy or market condition.
Overview:
The Gorb Market Trend isn't a simple trend-following tool; it's a sophisticated blend of traditional and innovative methods, providing comprehensive market analysis.
Its unique combination of EMA analysis, volume weighting, RSI, and stochastic indicators, along with proprietary algorithms, providing nuanced views in trend detection and trading confluences.
The indicator is designed for traders at all levels, offering a balance of depth for experienced traders and simplicity for beginners.
Centerpieces: Gorb Market Trend & Volume Strength
These use a color-coded system to indicate market direction/strength. The color: white is used to signal upward/bullish trend, while the color: purple is used to signal downward/bearish trend. It is designed for ease of use, simplifying complex market data into an easy visually understandable format.
How the Gorb Market Trend Works:
Moving averages are used to find convergence or divergence on multiple EMA's to help determine the overall market direction. Relative Strength Index is used to assess the speed and change of price movements to add another layer to the Market Trend lines identification of the markets analysis. It then plots a line using just two colors to provide traders with a visual representation of the trend. This can help traders quickly grasp the current market trend with simple color cues.
How the Volume Strength Works:
A stochastic oscillator is used to measure the current price level relative to its price over a specific range period to capture sentiment and potential reversals for the Trend Strength feature. And the final part is the use of VWAP and volume analysis to ensure that identified trends are not only based on price movements but are also supported by trading volume, adding a layer of reliability to the trend signals. These are then plotted at the bottom of the chart following the same color scheme as Gorb Market Trend. Only difference is, when volume strength begins to decline, the color will be more transparent, and when it is strong, the color will be bright.
Custom Algorithmic Elements:
The Gorb Market Trend isn't just a combination of standard indicators. It includes proprietary algorithmic elements tailored to enhance signal accuracy and timing. These unique components are what set the Gorb Market Trend apart from conventional trend-detection methods.
We recommend exploring every feature to pick & choose what best suits your needs and style of trading, and use that to combine with the Market trend line.
Features:
All skill-level friendly presets, easy to enable features with one-click
Trading Signals: Plotted signals to help traders identify changes in trend on the Gorb Market Trend Line (not to be followed blindly)
Match Volume Color: allows the user to enable signals to appear only if they match the trend strength's color
Enable MA Filter: allows the user to use 2 EMA's to create a custom trend filter in order to limit contrarian signals with the current trend
Chop Filter: allows the user to have a specific candle range of their choice to limit signals during sideways price movement
4 EMA's: allows the user to plot up to 4 EMA's on the chart and change to the users specific trading strategy with the Market Trend line
VWAP: allows users to plot VWAP on their chart to visually see where price is relatively
EMA Clouds: allows users to fill the gap between EMA's plotted on the chart to help them visualize zones for entries or stop-losses
Pivot Points: allows users to have pivots on their chart to use in tandem with market trend line to find areas of support and resistance to help find confluence in their trading
All colors are changeable for the user to customize the scheme to their liking or style
Basic Signals, Market Trend & Volume Strength Demonstration
In the image below, we can see a basic example of how these 3 core features function.
As explained above, the trade ideas are only generated if the user enables them. They will plot as small triangles in real time and are directly correlated to the market trend line coloring in order to quickly see the change in market conditions.
The volume strength on the bottom helps identify the strength and momentum of the market condition. This can also be used to identify possible fake-outs or small pullbacks before price continues on. The brighter the volume strength the stronger it is, when it is dimmer, that means volume is decreasing in that direction. This can help traders identify signals they may not want to trust as much.
Trading Tool Overlays with Signals
In the image below, we have enabled the EMA's and VWAP overlays from the settings. By using these tools, users can add more confluence to create their trading strategies
The EMA's are not only used for the market trends, trend filter. But also used as an additional confluence for general trend following purposes alongside the trade idea signals. These can be extremely useful for traders who like to have different length moving averages depending on their timeframe for analyzing the market.
In this next image, we can see that price dips down and then bounces up. With EMA clouds enabled, the user can now have visual zones to look for trade entries in.
When paired with the market trend line and trade idea signals, this adds a whole other level of easy visual trading confluence for traders. You can see that market trend changes color and a trade signal is plotted when price enters these zones. This can be helpful to a trader looking to find confluence in their entries.
The image below shows specific pivot levels being plotted when the user enabled pivots in the settings of the indicator.
The pivot levels proved an excellent area of support/resistance for traders that are generated fresh every day. These are particularly useful for areas that line up with previous tools above and trade signals. This overlay gives traders a clear level that can be used to confirm entries and create targets to exit trades at. These levels when combined with the other tools in this indicator provide traders an all-in-one visual confluences. Some traders may just use this overlay to have an idea on the range for the trading session.
Filters:
There are 3 different trade signal filters integrated into this indicator
1. Match Volume Color: When enabled, signals can only be valid and plotted if the volume strength color matches the market trend line signal. Otherwise the signal will not appear, this limits possible fake-outs without having volume agree.
2. MA Filter: When enabled, this removes an contrarian signals to the current market trend per the settings of the filter. The EMA settings for this filter can be changed by the user for them to customize this to their trading strategies. There are two settings, short ema and long ema to define the trend.
3. Chop Filter: When enabled, this disables signals that would normally appear in sideways price action. This setting is also customizable by the user; there are two settings: candle period and threshold. The candle period is how many candles back does this filter want to look to define its range. The threshold, is the amount of price deviation is allowed from this range in order to disable a signal.
Conclusion:
We believe in providing an all inclusive trading tool to help simplify trading for all traders. The goal is to provide a user-friendly, efficient tool that provides insights into market trends. For it to stand out for its simplicity and effectiveness, as a support tool for decision making.
How to get access:
You can see the Author's instructions to get access to this indicator
RISK DISCLAIMER
All content, tools, scripts & education provided by Monstanzer or Gorb Algo LLC are for informational & educational purposes only. Trading is risk and most lose their money, past performance does not guarantee future results.
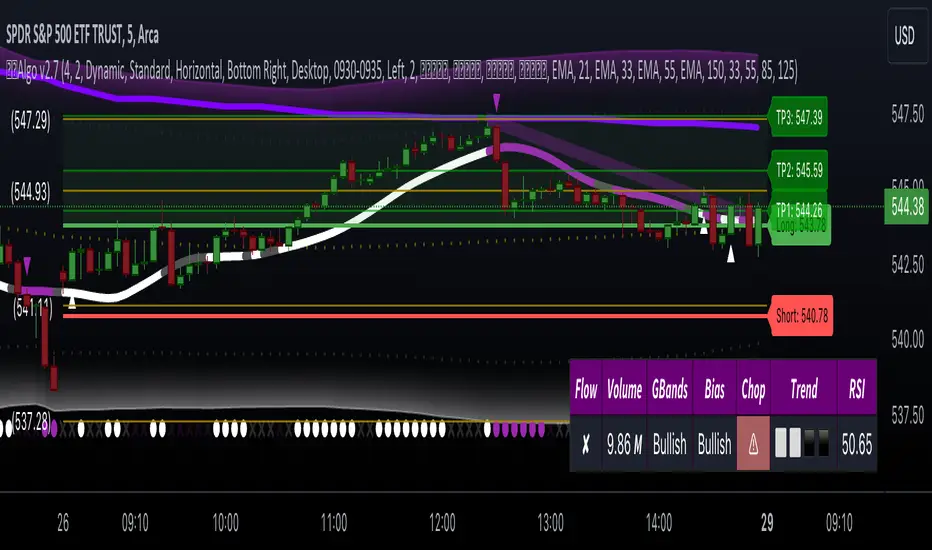
[Round Numbers] Signal Clean Up Analysis with Backtest (TSO)Round Numbers NEW GEN indicator!
===========================================================================
===========================================================================
This is a full-cycle trading system indicator - it will show and alert each step of the trade from open to close. The algorithm here uses Round Numbers for generating signals, TP (Take Profit) and SL (Stop Loss) levels. Round numbers play big role in trading and can easily become strong support and resistance levels where price can bounce and go the opposite way or go through with a very nice run afterwards.
In addition there is a chained (NOTE: You can select several or ALL of the features, this is not limited to either one) signal cleanup and analysis approach with scheduling and alerting capabilities. Works with most popular timeframes: 1M, 3M, 5M, 15M, 30M, 1H, 4H, D.
NOTE: Every action of the trade is calculated on a confirmed closed candle bar state (barstate.isconfirmed), so the indicator will never repaint!
NOTE: At position open - there will be calculated Take-Profit and Stop-Loss targets, however each target is considered hit, when candle bar closes breaking that target, so Take-Profit and Stop-Loss when hit will slightly differ then what you see at trade/position open.
===========================================================================
===========================================================================
Round Numbers up|down unit setting and overall explanation
---------------------------------------------------------------------------
Round Number up|down unit: is the distance between round numbers on the chart. Since these round number levels are also used by the algorithm to open/close trades, it is important to set this setting to a logical number, which will correspond to an average price movement of the instrument.
Here are some examples for a few popular instruments on what will the default 1 round number unit correspond to and what would be suggested:
BTCUSD > $1 (this won't work for Bitcoin, try at least $100 - 100units)
SPY: > $1 (one of the best settings for SPY or QQQ, 50cents shows good results as well - 0.5units)
FOREX (all major pairs): > 10PIPs (that may be a bit small, unless scalping, try 50PIPs - 5units)
===========================================================================
===========================================================================
Explanation of all the Features | Strategy Configuration Guide | Indicator Settings | Signal Cleanup Analysis
---------------------------------------------------------------------------
>>> Customizable Backtesting for a specific date range, results via TradingView strategy, which includes “Deep Backtesting” for largest amounts of data on trading results.
>>> Trading Schedule with customizable trading daily time range, automatic closing/alert trades before Power Hour or right before market closes or leave it open until next day.
>>> 3 Trading Systems.
>>> Static/Dynamic/Trailing Take-Profit and Stop-Loss setups (HIGHLIGHT: Stop-Loss will be moved to Entry after TP1 is taken or a smart trailing Stop-Loss can be used with Stop-Loss dynamically following the trade to minimize risk).
>>> Single or Multiple profit targets (up to 5).
>>> Take-Profit customizable offset feature (set your Take-Profit targets slightly before everyone is expecting it!).
>>> Candle bar signal analysis (matching candle color, skip opposite structured and/or doji candle uncertain signals).
>>> Additional analysis of VWAP/EMA/ATR/EWO (Elliot Wave Oscillator)/Divergence MACD+RSI/Volume signal confirmation (clean up your chart with indicator showing only the best potential signals!).
>>> Advanced Alerts setup, which can be potentially setup with a trading bot over TradingView Webhook (NOTE: This will require advanced programming knowledge).
===========================================================================
Labels, plots, colors explanations:
---------------------------------------------------------------------------
>>>>> LONG open: green "house" looking arrow below candle bar.
>>>>> SHORT open: red "house" looking arrow above candle bar.
>>>>> LONG/SHORT take-profit target: green/red circles (multi-profit > TP2/3/4/5 smaller circles).
>>>>> LONG/SHORT stop-loss target: green/red + crosses.
>>>>> LONG/SHORT take-profit hits: green/red diamonds.
>>>>> LONG/SHORT stop-loss hits: green/red X-crosses.
>>>>> LONG/SHORT EOD (End of Day | Intraday style) close (profitable trade): green/red squares.
>>>>> LONG/SHORT EOD (End of Day | Intraday style) close (loss trade): green/red PLUS(+)-crosses.
===========================================================================
Date Range and Trading Schedule Settings
---------------------------------------------------------------------------
>>>>> Date Range: Select your start and/or end dates (uncheck “End” for indicator to show results up to the very moment and to use for LIVE trading) for backtesting results, if not using backtesting – uncheck “Start”/“End” to turn it off.
>>>>> Use TradingView “Strategy Tester” to see backtesting results
NOTE: If Strategy Tester does not show any results with Date Ranged fully unchecked, there may be an issue where a script opens a trade, but there is not enough TradingView power to set the Take-Profit and Stop-Loss and somehow an open trade gets stuck and never closes, so there are “no trades present”. In such case you will need to manually check “Start”/“End” dates or use “Depp Backtesting” feature!
>>>>> Trading Schedule: This is where you can setup Intraday Session or any custom session schedule you wish. Turn it ON. Select trading hours. Select EOD (End of Day) setting (NOTE: If it will be OFF, the indicator will assume you are holding your position open until next day!). Please note the EOD trade closure times with the 2 different Intraday close settings when turned on:
At Market Close:
1/3/5min > will close at 15:55pm ET
15min > will close at 15:45pm ET
30min > will close at 15:30pm ET
45min > will close at 15:45pm ET
60min > will close at 15:00pm ET
Before Power Hour:
1/3/5min > will close at 15:00pm ET
15min > will close at 15:00pm ET
30min > will close at 15:00pm ET
45min > will close at 15:00pm ET
60min > will close at 15:00pm ET
>>> Trading Systems: 1) "Open Until Closed by TP or SL": the signal will only open a trade if no trades are currently open/trunning, a trade can only be closed by Take Profit, Stop Loss or End of Day close (if turned on) | 2) "Open Until Closed by TP or SL + OCA": Same as 1), but if there is an opposite signal to the trade which is currently open > it will immediately be closed with new trade open or End of Day close (if turned on) | 3) "OCA (no TP or SL)": There are is Take Profit or Stop Loss, only an opposite signal will close current trade and open an opposite one or End of Day close (if turned on).
>>> Turn On/Off: Current Position SL + Opposite Position Open Signal on the same closing candle bar (If current trade hits Stop-Loss and at that same closing candle bar there is a signal for an opposite direction trade > indicator will close current position as Stop-Loss and immediately open an opposite position). NOTE: With this option turned on, there will be more trades, but not necessarily better results, since after Stop-Loss is hit, it may make sense to wait a little before opening an opposite trade, even if it matches the condition at the same time when Stop-Loss is hit, but sometimes it shows great results, so this setting/feature is included. NOTE: This setting only will work/make sense with TP and SL style/behavior both be set to "Fully Closed Candle"!
>>> Turn On/Off: Turn On/Off: Current Position REGULAR SL | Only the SL + Opposite Position Open will trigger if turned on, IF NOT - THERE WILL BE NO STOP-LOSS AT ALL!!! NOTE: It is very dangerous to trade without Stop-Loss!
>>>>> Signal Candle Bar consuming Take-Profits - position/trade signal candle bar is big enough to "consume"/close ahead the first TP setting > the signal can either be skipped, or all Take-Profit areas pushed ahead using smart formula)
>>>>> MULTIPROFIT | TP (Take-Profit) System: 1) Static – Once the trade is open, all Take-Profit target(s) are immediately calculated and set for the trade > once the target(s) is hit > trade will be partially closed (if candle bar closes beyond several Take-Profit targets > trade will be reduced accordingly to the amount of how many Take-Profit targets were hit) ||| 2) Dynamic – Once the trade is open, only the 1st Take-Profit target is calculated, once the 1st Take-Profit is hit > next Take-Profit distance is calculated based on the distance from trade Entry to where 1st Take-Profit was taken, once 2nd Take-Profit is taken > 3rd Take-Profit is calculated per same logic, these are good for price momentum as with price speeding up – profits increase as well!
>>>>> MULTIPROFIT: SL (stop loss) System | Static: SL is set at position open and remains such; Dynamic: Once ANY TP is taken > SL will be moved to Entry; Trailing: SL will be moved along the position (smart trailing stop-loss), at TP1 taken > SL moves to Entry, at TP2 taken > SL moves to TP1, at TP3 taken > SL moves to TP2 and so on.
>>>>> # of TPs (number of take profit targets): Just like it is named, this is where you select the number of Take-Profit targets for your trading system (NOTE: If "OCA (no TP or SL)" Trading System is selected, this setting won’t do anything, since there are no TP or SLs for that system).
>>>>> TP(s) offset: This is a special feature for all Take-Profit targets, where you can turn on a customizable offset, so that if the price is almost hitting the Take-Profit target, but never actually touches it > you will capture it. This is good to use with HHLL (Highest High Lowest Low), which is pretty much a Support/Resistance as often the price will nearly touch these strong areas and turn around…
===========================================================================
Dynamic/Static/Trailing Take-Profit and Stop-Loss visual examples:
---------------------------------------------------------------------------
1) Fully Static Take-Profit and Stop-Loss
This one is a fully static setup for both Take-Profit and Stop-Loss, you can also observe how trade is closed right before the Power Hour (trade can be closed right before Power Hour or right before Market Closes or left overnight as desired).
2) Static/Dynamic, Static Take-Profit and Dynamic Stop-Loss
You can see a static Take-Profit set at position open, while Stop-Loss moves to Entry once TP1 target is taken.
3) Static/Trailing, Static Take-Profit and Trailing Stop-Loss
In here with each Take-Profit taken, Stop-Loss moves along the trade to previous Take-Profit level, you can notice how stop-loss literally follows the trade and reduces the potential loss.
4) Dynamic/Trailing, Dynamic Take-Profit and Trailing Stop-Loss
See how Take-Profit distances increase with price momentum. Just like in previous example - Trailing Stop-Loss is following the trade and reducing the riks.
===========================================================================
Signal Analysis and Cleanup Settings
---------------------------------------------------------------------------
>>>>> Candle Analysis | Candle Color signal confirmation: If closed candle bar color does not match the signal direction > no trade will be open.
>>>>> Candle Analysis | Skip opposite candle signals: If closed candle bar color will match the signal direction, but candle structure will be opposite (for example: bearish green hammer, long high stick on top of a small green square) > no trade will be open.
>>>>> Candle Analysis | Skip doji candle signals: If closed candle bar will be the uncertain doji > no trade will be open.
>>>>> Divergence/Oscillator Analysis | EWO (Elliot Wave Oscillator) signal confirmation: LONG will only be open if at signal, EWO is green or will be at bullish slope (you can select which setting you desire), SHORT if EWO is red or will be at bearish slope.
>>>>> Divergence/Oscillator Analysis | VWAP signal confirmation: LONG will only be open if at signal, the price will be above VWAP, SHORT if below.
>>>>> Divergence/Oscillator Analysis | Moving Average signal confirmation: LONG will only be open if at signal, the price will be above selected Moving Average, SHORT if below.
>>>>> Divergence/Oscillator Analysis | ATR signal confirmation: LONG will only be open if at signal, the price will be above ATR, SHORT if below.
>>>>> Divergence/Oscillator Analysis | RSI + MACD signal confirmation: LONG will only be open if at signal, RSI + MACD will be bullish, SHORT if RSI + MACD will be bearish.
>>>>> Volume signal confirmation: LONG/SHORT will only be opened with strong Volume matching the signal direction, by default, strong Volume percentage is set to 150% and weak to 50%, but you can change it as you desire.
===========================================================================
||||||||||||||||||||||||||||||||||| *** ||||||||||||||||||||||||||||||||||| *** |||||||||||||||||||||||||||||||||||
||||||||||||||||||||||||||||||||||| *** ||||||||||||||||||||||||||||||||||| *** |||||||||||||||||||||||||||||||||||
TP System - VERY IMPORTANT INFO!
-------------------------------------------------------------------------------------------------------------------
"TP PERCENTAGE" - amount by which current trade/position needs to be reduced/partially closed/sold.
-------------------------------------------------------------------------------------------------------------------
TP System: Dynamic
"TP PERCENTAGE" - will always be the same amount (trade/position size divided by the # of take-profit(TP) targets) and percentage to be closed will always be of the ORIGINAL trade/position.
-------------------------------------------------------------------------------------------------------------------
TP System: Static
"TP PERCENTAGE" - will always be the same amount IF take-profit(TP) targets are hit 1-by-1 (TP1 > TP2 > TP3 > TP4 > TP5), otherwise it will vary and unless it is a 1st take-profit(TP1), the REMAINING trade/position size will always be smaller than original and therefore the percentage to be closed will always be of the REMAINING trade/position and NOT the original one!
-------------------------------------------------------------------------------------------------------------------
"TP PERCENTAGE" CheatSheet (these are the only percentages you may see)
-----------------------------------------------------------------------
TP PERCENTAGE---Close/Sell Amount-------------Example (trade size: 50 stocks)
20%-------------trade size * 0.2--------------50 * 0.2 = 10 stocks
25%-------------trade size * 0.25-------------50 * 0.25 = 12.5(~13) stocks
34%-------------trade size * 0.34-------------50 * 0.34 = 17 stocks
40%-------------trade size * 0.4--------------50 * 0.4 = 20 stocks
50%-------------trade size * 0.5--------------50 * 0.5 = 25 stocks
60%-------------trade size * 0.6--------------50 * 0.6 = 30 stocks
66%-------------trade size * 0.66-------------50 * 0.66 = 33 stocks
75%-------------trade size * 0.75-------------50 * 0.75 = 37.5(~38) stocks
80%-------------trade size * 0.8--------------50 * 0.8 = 40 stocks
100%------------trade size--------------------50 = 50 stocks
-----------------------------------------------------------------------
If for any reason a portion of the current/remaining trade closed at such occurrence was slightly wrong, it is not an issue. Such occurrences are rare and with slight difference in partial TP closed is not significant to overall performance of our algorithms.
||||||||||||||||||||||||||||||||||| *** ||||||||||||||||||||||||||||||||||| *** |||||||||||||||||||||||||||||||||||
||||||||||||||||||||||||||||||||||| *** ||||||||||||||||||||||||||||||||||| *** |||||||||||||||||||||||||||||||||||
Alert Settings (you don’t have to touch this section unless you will be using TradingView alerts through a Webhook to use with trading bot)
---------------------------------------------------------------------------
Here is how a LONG OPEN alert looks like.
NOTE: Each label , , etc. is customizable, you can change the text of it within indicator Input settings.
ALERT >>>>>>>>>>>>>>>>>>>>>>>>>>>>>>>>>>>>>>>>>>>>>>>
COIN: BTCUSD
TIMEFRAME: 15M
LONG: OPEN
ENTRY: 20000
TP1: 20500
TP2: 21000
TP3: 21500
TP4: 22500
TP5: 23500
SL: 19000
Leverage: 0
---------------------------------------------------------------------------
Here is how a TP1 alert will look with 5 TPs breakdown of the trade.
NOTE1: Next to TP1 taken it will show at which price it was triggered.
NOTE2: Next to "TP Percentage" it shows how much of the CURRENT/ACTIVE/REMAINING trade needs to be closed.
NOTE2: If TP2/3/4/5 comes before TP1 - the alert will tell you exactly how many percent of the trade needs to be closed!
ALERT >>>>>>>>>>>>>>>>>>>>>>>>>>>>>>>>>>>>>>>>>>>>>>>
COIN: BTCUSD
TIMEFRAME: 15M
LONG: TP1
TP1: 20500
TP Percentage: 20%
---------------------------------------------------------------------------
Here is how an alert will look for LONG - STOP-LOSS.
ALERT >>>>>>>>>>>>>>>>>>>>>>>>>>>>>>>>>>>>>>>>>>>>>>>
COIN: BTCUSD
TIMEFRAME: 15M
ENTRY: 20000
LONG: SL
SL: 19000
---------------------------------------------------------------------------
Here is how an alert will look for LONG - EOD (End of Day) In Profit close.
ALERT >>>>>>>>>>>>>>>>>>>>>>>>>>>>>>>>>>>>>>>>>>>>>>>
COIN: BTCUSD
TIMEFRAME: 15M
LONG: EOD-Close (profit)
ENTRY: 20000
EOD-Close: 21900
===========================================================================
Adding Alerts in TradngView
---------------------------------------------------------------------------
-Add indicator to chart and make sure the correct strategy is configured (check Backtesting results)
-Right-click anywhere on the TradingView chart
-Click on Add alert
-Condition: Select this indicator by it’s name
-Immediately below, change it to "alert() function calls only", as other wise there will be 2 alerts for every alert!
-Expiration: Open-ended (that may require higher tier TradingView account, otherwise the alert will need to be occasionally re-triggered)
-Alert name: Whatever you desire
-Hit “Create”
-Note: If you change ANY Settings within the indicator – you must DELETE the current alert and create a new one per steps above, otherwise it will continue triggering alerts per old Settings!
===========================================================================
If you have any questions or issues with the indicator, please message me directly via TradingView.
---------------------------------------------------------------------------
Good Luck! (NOTE: Trading is very risky, past performance is not necessarily indicative of future results, so please trade responsibly!)
---------------------------------------------------------------------------
NOTE: There seems to be a strange glitch when strategy is running live, it will show "double-take" take-profits labels on the chart. This is not affecting the script logic and backtesting results, if you simply change the timeframe real quick to something else then back - it will no longer show the duplicate orders... this must be some sort of a glitch as every alert was thoroughly tested to make sure everything is working!

BE - Strategy Builder ToolkitIndicator vs Toolkit:
This is definitely not an indicator, hence this doesn't do any kind of analysis nor provide meaningful outputs where you can take trading decisions out of it.
This is a Strategy Builder Toolkit which works like any other broker/3P applications, which helps traders to build their own custom/ predefined strategies, save / deploy them at their wish.
Idea Behind Developing this Toolkit: I am sure many of traders have overcome scenarios where, on break of x level he wants to initiate straddle else he wants to initiate Iron Condor. Some of them wants to deploy custom strategies only at certain time or at certian price levels.
It becomes pretty difficult to track markets when you are away from desk and if you dont adjust the strategy legs, you are incurring big drawdowns. There are many if's and buts to deploy strategies.
To overcome such challenges, i have built this toolkit.
Note: As this is just a toolkit, you should conduct your analysis to gauge the market direction outside the perview of this. Once you know the view / direction of the script. you can use this toolkit in action to
1. Deploy Strategy at (Desired levels| Desired time|Confired Levels|Confirmed Volumes)
2. Strategy can be Prebuilt / Custom Built
3.1 Set SL, Target for Directional view (Trail SL aswell)
3.2 Set Upside or Downside Target for Non Directional view (Trail SL aswell)
3.3 let the strategy play with out SL|Targets for consolidation view.
4. Adjust Legs by closing existing position and opening fresh position or place fresh adjustments
5. Book partial Profits with in the zone.
How the Toolkit is buit: Script uses text related functions to understand the custom input given in the indicator and coverts into a strategy and deployes them as a algo trading (Next Level Bot) with the additional parameter set for SL|Target|Entry levels.
Understanding the settings:
1. Strike Difference: is basically a value between each strike. eg: Banknifty : 100, Nifty & Finnifty: 50
2. 1 Lot Qty: Qty per Lot accepted by exchange|Broker. eg: BNF: 15, Nifty: 50, Finnifty: 40
3. Lot Multiplier: If you build strategy with 1 lot and if you set the Lot multiplier as 2 then strategy gets deployed with 2 lots. for eg. If i have saved strategy to buy BNF 1 ITM with 1Lot and have set lot multipier to 3 then at the time of deploying the trade it pushes as 3 lots (3 * 15Qty per lot = 45Qty) of 1 ITM strike.
4. Symbol Name: Select the Symbol Name here.
5. Current & Next Week Expiry Date: Specify the expiry Dates in the format as supported by your broker.
6. Broker Name, Exchange & Product Type: hope it is self explanatory.
IMPORTANT settings to understand:
7. Triggere Entry Post (optional): You have to specify when you want to deploy the strategy. For instance, if i want to deploy my strategy at 30 min after market open which is 9:45 am, then i have specify as 0945. Another instance where i want to close my strategy at 3 PM then you have to specify as 1500. Uncheck this option if you are not worried about the time of entry.
My personal Used Case: On the Expiry -1 Day at 0916 (9:16AM) i will buy 6 lots of 8OTM PE & CE and Sell 2 lots 7OTM, 2 lots of 6OTM and 2 lots of 5OTM and close the trade by 1100 (11AM).
8. Price Levels (Confirmed vs UnConfirmed) (Optional): Confirmed is basically price is sustained at|around the specified price level, where in UnConfirmed is basically the touch of the specified level.
for instance if i want to deploy straddle only if price is sustained at 100. then, i would specify GE with 100 in price input settings, and check thee Confirmed price box. Assuming if LTP is running at 98 and with the above settings it will only deploy the trade upon price is sustained at 100 level for 3 to 5 candles not at the touch of 100.
Uncheck this option if you are not worried about the Entry Price.
9. Confirmed Volume (Optional) (Long or Short): Basis your view|direction of the strategy. you can get additional confirmation. At the time of entry you want volume to be present towards the direction of the strategy. Uncheck this option if you are not worried about the volume or Volume doesn't exist for the chart loaded.
10. Alert Types: It consists of 3 Long & 3 Short directional (prebuilt) strategy along with Close Strategy, Close Specified Symbols Only & Design Custom Strategy Option.
10.1 : Slow Upmove - If you are having bullish view and predict that prices shall go slow and steady. This strategy can be deployed where you get the benifit of time decay as well while the delta play in favor of you. (viseversa for Slow DownMove)
10.2 : Fast Upmove - If you are having bullish view and predict that prices shall go fast. This strategy can be deployed where you get the smaller benifit of time decay as well while the delta play in favor of you. (viseversa for Fast DownMove)
10.3 : Vol Upmove (Volatality)- If you are having bullish view and predict market is tend to be volatile. This strategy can be deployed where you get the benifit of volatility as well while the delta play in favor of you. (viseversa for VolDownMove)
10.4 : Close Trade - You can use this option close the deployed strategy completely.
10.5 : Close Symbols - You can use this option close few of the symbols for the strategy deployed.
10.6 : Custom: Use this option to design you own custom strayegy with the syntax below:
Sample 1:
N|B|C2|3
N refers to Nextweek Expiry (if C is used then Current week expiry)
B refers to Buy (if S is used then Sell)
C refers to Call | CE (if P is used then PE or Put)
2 refers to 2OTM (for CE any Postitive number refers to as OTM and for PE it will be treated as ITM strikes & 0 refers to as ATM - viseversa for Negative Numbers)
3 refers to as 3 Lot
With the syntax of N|B|C2|3 - strategy will be deployed as "Buy 3 lots of 2 OTM Call of Next expiry"
Sample 2:
C|S|P-3|3|10|30
Above syntax means: SELL Current Expiry 3 Lots of 3 OTM Put Strike with 10 SL and 30 TGT
Sample 3:
C|S|C10|3|Default
Above syntax means: SELL Current Expiry 3 Lots of 10 OTM CALL Strike with 50% SL and 95% TGT
Sample 4:
C|B|C-2|3|40%|50%
Above syntax means: BUY Current Expiry 3 Lots of 2 ITM CALL Strike with 40% SL and 50% TGT
Sample 5: Long Straddle
C|B|C0|3
C|B|P0|3
Above syntax means: BUY Current Expiry 3 Lots of ATM CALL & PUT Strike
Sample 6: Iron Butterfly
C|B|C1|1
C|S|C0|1
C|S|P0|1
C|B|P-1|1
Above syntax means: Sell Current Expiry 1 Lots of ATM CALL & PUT Strike and BUY 1OTM Call & Put Strike
Sample 7: Diagonal Spread
C|S|C2|1
C|S|P-2|1
N|B|C3|1
N|B|P-3|1
Above syntax means: Sell Current Expiry 1 Lots of 2OTM CALL & PUT Strike and BUY 3OTM Call & Put Strike of Next Expiry.
To Understand how to deploy Strategy with defined Adjustments. For instance i want to deploy Iron Condor with Adjustments for BNF when the price is currently running at 45000.
C|B-|C3|1
C|S*|C2|1
C|B--|P-3|1
C|S**|P-2|1
At:2|C|S|C2|1
At:2|C|B|C3|1
At:-2|C|S|P-2|1
At:-2|C|B|P-3|1
On:2|*
On:-2|**
On:2|-
On:-2|--
With the above syntax: Intial trades are placed with
BUY BANKNIFTY45300CALL(Current Expiry) 1 Lot
BUY BANKNIFTY44700PUT(Current Expiry) 1 Lot
SELL BANKNIFTY45200CALL(Current Expiry) 1 Lot
SELL BANKNIFTY44800PUT(Current Expiry) 1 Lot
Toolkit tracks the price and holds the adjustments.
We may start to bleed on the sold leg (45200CALL) once the price crosses 45200. Hence if the price crosses 2 strike upside as specified with syntax " On:2|* " where * is a character tagged to Sold Call Leg. it closes the 45200 Call.
Similarly, " On:2|- " where - is character tagged to Brought Call Leg. it closes the 45300 Call, as soon as prices reaches 2 strike upside.
At:2|C|S|C2|1
At:2|C|B|C3|1
With the At Statements you can place the fresh adjustments legs. Above syntax refers to Once the price reaches 45200 it places below adjustment legs.
BUY BANKNIFTY45500CALL(Current Expiry) 1 Lot
SELL BANKNIFTY45400CALL(Current Expiry) 1 Lot
Note: Similarly If prices reaches downside with the On and At Sytax it places the necessary adjustment legs accordingly.
11. SL & TGT - You can specify SL, TGT or Upside & Dowside TGT during the entry conditions and Stratey shall be closed upon hitting either the SL or TGT accordingly.
12. On % Tgt & Lock % SL: This option is used for Prebuilt strategy where you can lock the Profit | Set Revised SL upon hitting specified TGT percentage.
13. Close Symbols: This option is used if you select Alert type as Close Symbols (Ref - 10.5 : Close Symbols) for specified list of symbols Alert shall be pushed to close the open positions of those symbols.
DISCLAIMER: No sharing, copying, reselling, modifying, or any other forms of use are authorized for our documents, script / strategy, and the information published with them. This informational planning script / strategy is strictly for individual use and educational purposes only. This is not financial or investment advice. Investments are always made at your own risk and are based on your personal judgement. I am not responsible for any losses you may incur. Please invest wisely.
Happy to receive suggestions and feedback in order to improve the performance of the indicator better.

SOFEX High-End Indicators + BacktestingBINANCE:BTCUSDT.P BINANCE:ETHUSDT.P
Introducing the first publicly available suite of indicators for Bitcoin and Ethereum by Sofex - the High-End Indicators & Backtesting System.
🔬 Trading Philosophy
The High-End Indicators & Backtesting system offers both trend-following and mean-reversal algorithms to provide traders with a deep insight into the highly volatile cryptocurrency markets, known for their market noise and vulnerability to manipulation.
With these factors in mind, our indicators are designed to sidestep most potentially false signals. This is facilitated further by the "middle-ground" time frame (1 Hour) we use. Our focus is on the two largest cryptocurrencies: Bitcoin and Ethereum , which provide high liquidity, necessary for reliable trading.
Therefore, we recommend using our suite on these markets.
The backtesting version of the Sofex High-End Indicators includes mainly trend-following indicators. This is because our trading vision is that volatility in cryptocurrency markets is a tool that should be used carefully, and many times avoided. Furthermore, mean-reversal trading can lead to short-term profits, but we have found it less than ideal for long-term trading.
The script does not aim to make a lot of trades, or to always remain in a position and switch from long to short. Many times there is no direction and the market is in "random walk mode", and chasing trades is futile.
Based on our experience, it is preferable if traders remain neutral the majority of the time and only enter trades that can be exited in the foreseeable future. Trading just for the sake of it ultimately leads to loss in the long-run.
Expectations of performance should be realistic.
We also focus on a balanced take-profit to stop-loss ratio. In the default set-up of the script, that is a 2% : 2% (1:1) ratio. A relatively low stop loss and take profit build onto our idea that positions should be exited promptly. There are many options to edit these values, including enabling trailing take profit and stop loss. Traders can also completely turn off TP and SL levels, and rely on opposing signals to exit and enter new trades.
Extreme scenarios can happen on the cryptocurrency markets, and disabling stop-loss levels completely is not recommended. The position size should be monitored since all of it is at risk with no stop-loss.
We take pride in presenting this comprehensive suite of trading indicators, designed for both manual and automated use. Although automated use leads to increased efficiency, traders are free to incorporate any of our indicators into their own manual trading strategy.
⚙️ Indicators
By default, all indicators are enabled for both Long and Short trades.
Extreme Trend Breakouts
The Extreme Trend Breakouts indicator seeks to follow breakouts of support and resistance levels, while also accounting for the unfortunate fact that false signals can be generated on these levels. The indicator combines trend-breakout strategies with various other volatility and direction measurements. It works best in the beginning of trends.
Underpinning this indicator are renowned Perry Kaufman's Adaptive Moving Averages (PKAMA) alongside our proprietary adaptive moving averages. These dynamic indicators adjust their parameters based on recent price movements, attempting to catch trends while maintaining consistent performance in the long run.
In addition, our modification of the TTM Squeeze indicator further enhances the Extreme Trend Breakouts indicator, making it more responsive, especially during the initial stages of trends and filtering of "flat" markets.
High-Volatility Trend Follower
The High-Volatility Trend Follower indicator is based around the logic of evading market conditions where volatility is low (choppy markets) and aggressively following confirmed trends. The indicator works best during strong trends, however, it has the downside of entering trades at trend tops or bottoms.
This indicator also leverages our proprietary adaptive moving averages to identify and follow high-volatility trends effectively. Furthermore, it uses the Average Directional Index, Aroon Oscillator, ATR and a modified version of VWAP, to categorize trends into weak or strong ones. The VWAP indicator is used to identify the monetary (volume) inflow into a given trend, further helping to avoid short-term manipulations.
Low-Volatility Reversal
The Low-Volatility Reversal aims at plugging the holes that trend-following indicators ignore. It specifically looks for choppy markets. Using proven concepts such as Relative Strength Index and volume measurements, among others, this indicator finds local tops and bottoms with good accuracy. It works best in choppy markets with low to medium volatility. It has a downside that all reversals have, losing trades at the end of choppy markets and in the beginning of big trends.
This indicator, like the others, employs PKAMA in conjunction with our proprietary adaptive moving averages, and an Average PSAR indicator to seek out "sideways" markets. Furthermore, Bollinger Bands with an adaptive basis line is used, with the idea of trading against the short-term trends by looking at big deviations in price movement. The above mentioned indicators attempt to catch local tops and bottoms in markets.
Adaptive Trend Convergence
The Adaptive Trend Convergence aims at following trends while avoiding entering positions at local bottoms and tops. It does so by comparing a number of adaptive moving averages and looking for convergence among them. Adaptive filtering techniques for avoiding choppy markets are also used.
This indicator utilizes our proprietary adaptive moving averages, and an Average Price Range indicator to identify trend convergence and divergence effectively, preventing false signals during volatile market phases. It also makes use of Bollinger Bands with an adaptive moving average basis line and price-action adjusted deviation. Contrasting to the Low-Volatility Reversal condition described above, the Bollinger Bands used here attempt to follow breakouts outside of the lower and upper bands.
Double-Filtered Channel Breakouts
The Double-Filtered Channel Breakouts indicator is made out of adaptive channel-identifying indicators. The indicator then follows trends that significantly diverge from the established channels. This aims at following extreme trends, where rapid, continuous movements in either direction occur. This indicator works best in very strong trends and follows them relentlessly. However, these strong trends can end in strong reversals, and the indicator can be stopped out on the last trade.
Our Double-Filtered Channel Breakouts indicator is built on a foundation of adaptive channel indicators. We've harnessed the power of Keltner Channels and Bollinger Band Channels, with a similar approach used in the Adaptive Trend Convergence indicator. The basis and upper/lower bands of the channels do not rely on fixed deviation parameters, rather on adaptive ones, based on price action and volatility. This combination seeks to identify and follows extreme trends.
Direction Tracker
The Direction Tracker indicator is made out of a central slower, adaptive moving average that clearly recognizes global, long-term trends. Combined with direction and range indicators, among others, this indicator excels at finding the long-term trend and ignoring temporary pullbacks in the opposite direction. It works best at the beginning and middle of long and strong trends. It can fail at the end of trends and on very strong historical resistance lines (where sharp reversals are common).
Our Direction Tracker indicator integrates an adaptive SuperTrend indicator into its core, alongside our proprietary adaptive moving averages, to accurately identify and track long-term trends while mitigating temporary pullbacks. Furthermore, it uses Average True Range, ADX and other volatility indicators to attempt to catch unusual moves on the market early-on.
📟 Parameters Menu
To offer traders flexibility, our system comes with a comprehensive parameter menu:
Preset Selection : Choose between Bitcoin or Ethereum presets to tailor the indicators to your preferred cryptocurrency market.
Global Signal Direction: Set the global signal direction as Long, Short, or Both, depending on your trading strategy.
Global Sensitivity Parameter : Adjust the system's sensitivity to adapt to different trend-following conditions, particularly beneficial during higher-strength trends.
Source of Signals : Toggle individual indicators on or off according to your preference. By default, all indicators are enabled. Customize the indicators to trade Long, Short, or Both, aligning them with your desired market exposure.
Confirmation of Signals : Set the minimum number of confirmed signals on the same bar, ensuring signals are generated only when specific confirmation criteria are met. The default value is one, and it can be adjusted for both Long and Short signals.
Exit of Signals : You have options regarding Take-Profit (TP) and Stop-Loss (SL) levels. Enable TP/SL levels to exit trades at predetermined levels, or disable them to rely on direction changes for exits. Be aware that removing stop losses can introduce additional risk, and position sizing should be carefully monitored.
By enabling Trailing TP/SL, the system switches to a trailing approach, allowing you to:
- Place an initial customizable SL.
- Specify a level (%) for the Trailing SL to become active.
- When the activation level is reached, the system moves the trailing stop by a given Offset (%).
Additionally, you can enable exit at break-even, where the system places an exit order when the trail activation level is reached, accounting for fees and slippage.
Alert Messages : Define the fields for alert messages based on specific conditions. You can set up alerts to receive email, SMS, and in-app notifications. If you use webhooks for alerts, exercise caution, as these alerts can potentially execute trades without human supervision.
Backtesting : Default backtesting parameters are set to provide realistic backtesting performance:
- 0.04% Commission per trade (for both entries and exits)
- 3 ticks Slippage (highly dependent on exchange)
- Initial capital of $1000
- Order size of $1000
While the order size is equal to the initial capital, the script employs a 2% stop-loss order to limit losses and attempts to prevent risky trades from creating big losses. The order size is a set dollar value, so that the backtesting performance is linear, instead of using % of capital which may result in unrealistic backtesting performance.
Risk Disclaimer
Please be aware that backtesting results, while valuable for statistical overview, do not guarantee future performance in any way. Cryptocurrency markets are inherently volatile and risky. Always trade responsibly and do not risk more than you can afford to lose.

[Camarilla Pivots] Signal Clean Up Analysis with Backtest (TSO)Camarilla Pivots NEW GEN Indicator!
This is a full-cycle trading system indicator, which uses Camarilla Pivots for generating signals using a custom developed algorithm, TP (Take Profit) and SL (Stop Loss) levels. There are 3 SOURCES for signals (each can be used separately or in combination or all 3 can be used at the same time, each signal SOURCE is using Camarilla Pivots levels to open optimal trade direction) with chained (NOTE: There are many potential profitable setups available, by combining clean up features availabe in the indicator settings!) signal cleanup and analysis approach with scheduling and alerting capabilities. Works best with shorter timeframes: 1M, 5M, 15M, 1H.
NOTE: Every calculation is done on a confirmed closed candle bar state, so the indicator will never repaint!
NOTE: At position open - there will be calculated Take-Profit and Stop-Loss targets, however each target is considered hit, when candle bar closes breaking that target, so Take-Profit and Stop-Loss when hit will slightly differ then what you see at position open!
===========================================================================
Explanation of all the Features | Configuration Guide | Indicator Settings | Signal Cleanup Analysis
---------------------------------------------------------------------------
>>> Customizable Backtesting for a specific date range, results via TradingView strategy, which includes “Deep Backtesting” for largest amounts of data on trading results.
>>> Trading Schedule with customizable trading daily time range, automatic closing/alert trades before Power Hour or right before market closes or leave it open until next day.
>>> 3 Trading Systems.
>>> Multiple Signal SOURCEs for opening trades, either SOURCE can be used or both at the same time!
>>> Static/Dynamic Stop-Loss setups (HIGHLIGHT: Stop-Loss will be moved to Entry after TP1 is taken, which minimizes risk).
>>> Single or Multiple profit targets (up to 5).
>>> Take-Profit customizable offset feature (set your Take-Profit targets slightly before everyone is expecting it!).
>>> Candle bar signal analysis (matching candle color, skip opposite structured and/or doji candle uncertain signals).
>>> Additional analysis of VWAP/EMA/ATR/EWO (Elliot Wave Oscillator)/Divergence MACD+RSI/Volume signal confirmation (clean up your chart with indicator showing only the best potential signals!).
>>> Advanced Alerts setup, which can be potentially setup with a trading bot over TradingView Webhook (NOTE: This will require advanced programming knowledge).
===========================================================================
Labels, plots, colors explanations:
---------------------------------------------------------------------------
>>>>> LONG open: green "house" looking arrow below candle bar.
>>>>> SHORT open: red "house" looking arrow above candle bar.
>>>>> LONG/SHORT take-profit target: green/red circles (multi-profit > TP2/3/4/5 smaller circles).
>>>>> LONG/SHORT stop-loss target: green/red + crosses.
>>>>> LONG/SHORT take-profit hits: green/red diamonds.
>>>>> LONG/SHORT stop-loss hits: green/red X-crosses.
>>>>> LONG/SHORT EOD (End of Day | Intraday style) close (profitable trade): green/red squares.
>>>>> LONG/SHORT EOD (End of Day | Intraday style) close (loss trade): green/red PLUS(+)-crosses.
===========================================================================
Date Range and Trading Schedule Settings
---------------------------------------------------------------------------
>>>>> Date Range: Select your start and/or end dates (uncheck “End” for indicator to show results up to the very moment and to use for LIVE trading) for backtesting results, if not using backtesting – uncheck “Start”/“End” to turn it off.
>>>>> Use TradingView “Strategy Tester” to see backtesting results
NOTE: If Strategy Tester does not show any results with Date Ranged fully unchecked, there may be an issue where a script opens a trade, but there is not enough TradingView power to set the Take-Profit and Stop-Loss and somehow an open trade gets stuck and never closes, so there are “no trades present”. In such case you will need to manually check “Start”/“End” dates or use “Depp Backtesting” feature!
>>>>> Trading Schedule: This is where you can setup Intraday Session or any custom session schedule you wish. Turn it ON. Select trading hours. Select EOD (End of Day) setting (NOTE: If it will be OFF, the indicator will assume you are holding your position open until next day!). Please note the EOD trade closure times with the 2 different Intraday close settings when turned on:
At Market Close:
1/3/5min > will close at 15:55pm ET
15min > will close at 15:45pm ET
30min > will close at 15:30pm ET
45min > will close at 15:45pm ET
60min > will close at 15:00pm ET
Before Power Hour:
1/3/5min > will close at 15:00pm ET
15min > will close at 15:00pm ET
30min > will close at 15:00pm ET
45min > will close at 15:00pm ET
60min > will close at 15:00pm ET
>>> Trading Systems: 1) "Open Until Closed by TP or SL": the signal will only open a trade if no trades are currently open/trunning, a trade can only be closed by Take Profit, Stop Loss or End of Day close (if turned on) | 2) "Open Until Closed by TP or SL + OCA": Same as 1), but if there is an opposite signal to the trade which is currently open > it will immediately be closed with new trade open or End of Day close (if turned on) | 3) "OCA (no TP or SL)": There are is Take Profit or Stop Loss, only an opposite signal will close current trade and open an opposite one or End of Day close (if turned on).
>>> Position Open sources:
>>>>> Position Open - SOURCE1 | LONG: S3, SL: S4, TP1: R3, TP2: R4, TP3: R5, TP4/5: Smart Formula | SHORT: R3, SL: R4, TP1: S3, TP2: S4, TP3: S5, TP4/5: Smart Formula
>>>>> Position Open - SOURCE2 | LONG: R4, SL: R3, TP1: R5, TP2/3/4/5: Smart Formula | SHORT: S4, SL: S3, TP1: S5, TP2/3/4/5: Smart Formula
>>>>> Position Open - SOURCE3 | LONG: R5, SL: R4, TP1/2/3/4/5: Smart Formula | SHORT: S5, SL: S4, TP1/2/3/4/5: Smart Formula
>>> Turn On/Off: Current Position SL + Opposite Position Open Signal on the same closing candle bar (If current trade hits Stop-Loss and at that same closing candle bar there is a signal for an opposite direction trade > indicator will close current position as Stop-Loss and immediately open an opposite position). NOTE: With this option turned on, there will be more trades, but not necessarily better results, since after Stop-Loss is hit, it may make sense to wait a little before opening an opposite trade, even if it matches the condition at the same time when Stop-Loss is hit, but sometimes it shows great results, so this setting/feature is included.
>>> Turn On/Off: Turn On/Off: Current Position REGULAR SL | Only the SL + Opposite Position Open will trigger if turned on, IF NOT - THERE WILL BE NO STOP-LOSS AT ALL!!! NOTE: It is very dangerous to trade without Stop-Loss!
>>>>> Signal Candle Bar consuming Take-Profits - position/trade signal candle bar is big enought to "consume"/close ahead the first TP setting > the signal can either be skipped, or all Take-Profit areas pushed ahead using smart formula)
>>>>> MULTIPROFIT | TP (Take-Profit) System: Once the trade is open, all Take-Profit target(s) are immediately calculated and set for the trade > once the target(s) is hit > trade will be partially closed (if candle bar closes beyond several Take-Profit targets > trade will be reduced accordingly to the amount of how many Take-Profit targets were hit)
>>>>> MULTIPROFIT | SL (Stop-Loss) System: 1) Static – Once the trade is open, Stop-Loss is calculated and set for the remaining of the trade ||| 2) Dynamic – At trade open, Stop-Loss is calculated and set the same way, however once 1st Take-Profit is taken > Stop-Loss is moved to Entry, reducing the risk.
>>>>> # of TPs (number of take profit targets): Just like it is named, this is where you select the number of Take-Profit targets for your trading system (NOTE: If "OCA (no TP or SL)" Trading System is selected, this setting won’t do anything, since there are no TP or SLs for that system).
>>>>> TP(s) offset: This is a special feature for all Take-Profit targets, where you can turn on a customizable offset, so that if the price is almost hitting the Take-Profit target, but never actually touches it > you will capture it. This is good to use with HHLL (Highest High Lowest Low), which is pretty much a Support/Resistance as often the price will nearly touch these strong areas and turn around…
===========================================================================
Signal Analysis and Cleanup Settings
---------------------------------------------------------------------------
>>>>> Candle Analysis | Candle Color signal confirmation: If closed candle bar color does not match the signal direction > no trade will be open.
>>>>> Candle Analysis | Skip opposite candle signals: If closed candle bar color will match the signal direction, but candle structure will be opposite (for example: bearish green hammer, long high stick on top of a small green square) > no trade will be open.
>>>>> Candle Analysis | Skip doji candle signals: If closed candle bar will be the uncertain doji > no trade will be open.
>>>>> Divergence/Oscillator Analysis | EWO (Elliot Wave Oscillator) signal confirmation: LONG will only be open if at signal, EWO is green or will be at bullish slope (you can select which setting you desire), SHORT if EWO is red or will be at bearish slope.
>>>>> Divergence/Oscillator Analysis | VWAP signal confirmation: LONG will only be open if at signal, the price will be above VWAP, SHORT if below.
>>>>> Divergence/Oscillator Analysis | Moving Average signal confirmation: LONG will only be open if at signal, the price will be above selected Moving Average, SHORT if below.
>>>>> Divergence/Oscillator Analysis | ATR signal confirmation: LONG will only be open if at signal, the price will be above ATR, SHORT if below.
>>>>> Divergence/Oscillator Analysis | RSI + MACD signal confirmation: LONG will only be open if at signal, RSI + MACD will be bullish, SHORT if RSI + MACD will be bearish.
>>>>> Volume signal confirmation: LONG/SHORT will only be opened with strong Volume matching the signal direction, by default, strong Volume percentage is set to 150% and weak to 50%, but you can change it as you desire.
===========================================================================
||||||||||||||||||||||||||||||||||| *** ||||||||||||||||||||||||||||||||||| *** |||||||||||||||||||||||||||||||||||
||||||||||||||||||||||||||||||||||| *** ||||||||||||||||||||||||||||||||||| *** |||||||||||||||||||||||||||||||||||
TP System - VERY IMPORTANT INFO!
-------------------------------------------------------------------------------------------------------------------
"TP PERCENTAGE" - amount by which current trade/position needs to be reduced/partially closed/sold.
-------------------------------------------------------------------------------------------------------------------
TP System: Dynamic
"TP PERCENTAGE" - will always be the same amount (trade/position size divided by the # of take-profit(TP) targets) and percentage to be closed will always be of the ORIGINAL trade/position.
-------------------------------------------------------------------------------------------------------------------
TP System: Static
"TP PERCENTAGE" - will always be the same amount IF take-profit(TP) targets are hit 1-by-1 (TP1 > TP2 > TP3 > TP4 > TP5), otherwise it will vary and unless it is a 1st take-profit(TP1), the REMAINING trade/position size will always be smaller than original and therefore the percentage to be closed will always be of the REMAINING trade/position and NOT the original one!
-------------------------------------------------------------------------------------------------------------------
"TP PERCENTAGE" CheatSheet (these are the only percentages you may see)
-----------------------------------------------------------------------
TP PERCENTAGE---Close/Sell Amount-------------Example (trade size: 50 stocks)
20%-------------trade size * 0.2--------------50 * 0.2 = 10 stocks
25%-------------trade size * 0.25-------------50 * 0.25 = 12.5(~13) stocks
34%-------------trade size * 0.34-------------50 * 0.34 = 17 stocks
40%-------------trade size * 0.4--------------50 * 0.4 = 20 stocks
50%-------------trade size * 0.5--------------50 * 0.5 = 25 stocks
60%-------------trade size * 0.6--------------50 * 0.6 = 30 stocks
66%-------------trade size * 0.66-------------50 * 0.66 = 33 stocks
75%-------------trade size * 0.75-------------50 * 0.75 = 37.5(~38) stocks
80%-------------trade size * 0.8--------------50 * 0.8 = 40 stocks
100%------------trade size--------------------50 = 50 stocks
-----------------------------------------------------------------------
If for any reason a portion of the current/remaining trade closed at such occurrence was slightly wrong, it is not an issue. Such occurrences are rare and with slight difference in partial TP closed is not significant to overall performance of our algorithms.
||||||||||||||||||||||||||||||||||| *** ||||||||||||||||||||||||||||||||||| *** |||||||||||||||||||||||||||||||||||
||||||||||||||||||||||||||||||||||| *** ||||||||||||||||||||||||||||||||||| *** |||||||||||||||||||||||||||||||||||
Alert Settings (you don’t have to touch this section unless you will be using TradingView alerts through a Webhook to use with trading bot)
---------------------------------------------------------------------------
Here is how a LONG OPEN alert looks like.
NOTE: Each label , , etc. is customizable, you can change the text of it within indicator Input settings.
ALERT >>>>>>>>>>>>>>>>>>>>>>>>>>>>>>>>>>>>>>>>>>>>>>>
COIN: BTCUSD
TIMEFRAME: 15M
LONG: OPEN
ENTRY: 20000
TP1: 20500
TP2: 21000
TP3: 21500
TP4: 22500
TP5: 23500
SL: 19000
Leverage: 0
---------------------------------------------------------------------------
Here is how a TP1 alert will look with 5 TPs breakdown of the trade.
NOTE1: Next to TP1 taken it will show at which price it was triggered.
NOTE2: Next to "TP Percentage" it shows how much of the CURRENT/ACTIVE/REMAINING trade needs to be closed.
NOTE2: If TP2/3/4/5 comes before TP1 - the alert will tell you exactly how many percent of the trade needs to be closed!
ALERT >>>>>>>>>>>>>>>>>>>>>>>>>>>>>>>>>>>>>>>>>>>>>>>
COIN: BTCUSD
TIMEFRAME: 15M
LONG: TP1
TP1: 20500
TP Percentage: 20%
---------------------------------------------------------------------------
Here is how an alert will look for LONG - STOP-LOSS.
ALERT >>>>>>>>>>>>>>>>>>>>>>>>>>>>>>>>>>>>>>>>>>>>>>>
COIN: BTCUSD
TIMEFRAME: 15M
ENTRY: 20000
LONG: SL
SL: 19000
---------------------------------------------------------------------------
Here is how an alert will look for LONG - EOD (End of Day) In Profit close.
ALERT >>>>>>>>>>>>>>>>>>>>>>>>>>>>>>>>>>>>>>>>>>>>>>>
COIN: BTCUSD
TIMEFRAME: 15M
LONG: EOD-Close (profit)
ENTRY: 20000
EOD-Close: 21900
===========================================================================
Adding Alerts in TradngView
---------------------------------------------------------------------------
-Add indicator to chart and make sure it is configured (check back-testing results)
-Right-click anywhere on the TradingView chart
-Click on Add alert
-Condition: Select this indicator by it’s name
-Alert name: Whatever you want
-Hit “Create”
-Note: If you change ANY Settings within the indicator – you must DELETE the current alert and create a new one per steps above, otherwise it will continue triggering alerts per old Settings!
===========================================================================
If you have any questions or issues with the indicator, please message me directly via TradingView.
---------------------------------------------------------------------------
Good Luck! (NOTE: Trading is very risky, past performance is not necessarily indicative of future results, so please trade responsibly!)
---------------------------------------------------------------------------
NOTE: There seems to be a strange glitch when strategy is running live, it will show "double-take" take-profits labels on the chart. This is not affecting the script logic and backtesting results, if you will remove/re-add the script afterwards, it will no longer show the duplicate orders... this must be some sort of a glitch as every alert was thoroughly tested to make sure everything is working!

BE - Spread_IndicatorSpread Indicator: An Overview Driven by the concept of forethought. The indicator predicts the range for the day and divides it into two or three Levels (upper, middle, and lower).
These ranges are drawn from possible supply and demand zones as well as potential price consolidation zones which has happend in the rolling number of days in the past.
It's true that market respects history. Which means the zones which are untested and created new in recent past shall be respected in the future days. Also the most respected Zones switch between support and resistance based on the price and volume pumped into the market.
Calucations Involved In the Indicator:
Indicator takes into account Factrol points, Fibonachi and its Retracements along with Channel and Candle Ranges to calculate the levels accordingly.
Levels Information:
Levels should be Treated and Traded the way like POC (Point Of Control). Price within the levels are basically controled by the levels above and underneath.
Converting idea to TradeOpportunity:
One can look into deploying IronCondor, while it is within the Zone also One Can deploy Long Straddle when the levels are Tested.
My personal Observation not a Trade Recommendation
With an Option Buyer view, I have been testing this indicator on the Index (BankNifty, FinNifty & Nifty) on 5 Min TF and 15 Min TF. Banknifty Works Well with Bull & Bear Spreads and FinNifty along with Nifty Works Well with Long Straddle & Long Strangle.
Happy to receive Suggesstions and feedback to improvise it with better option strategy.
Features:
1. Integrated with NLB for AlgoTrading.
2. Timely Alerts for Levels, Formation, Breach, TestOf Levels, CrossOvers.
3. Position Can be traded as CarryForward or Intraday.

[Volume Profile] Signal Clean Up Analysis with Backtest (TSO) This is a full-cycle trading system indicator, which uses Volume Profile for generating signals using a custom developed algorithm, TP (Take Profit) and SL (Stop Loss) levels. There are 2 SOURCES for signals (each can be used separately or both can be used at the same time, each signal SOURCE is using Volume Profile levels to open optimal trade direction) with chained (NOTE: You can select several or ALL of the features, this is not limited to either one) signal cleanup and analysis approach with scheduling and alerting capabilities. Works with most popular timeframes: 1M, 5M, 15M, 1H, 4H, D, great for intraday trading!
NOTE: Every calculation is done on a confirmed closed candle bar state, so the indicator will never repaint!
===========================================================================
Explanation of all the Features | Configuration Guide | Indicator Settings | Signal Cleanup Analysis
---------------------------------------------------------------------------
>>> Customizable Backtesting for a specific date range, results via TradingView strategy, which includes “Deep Backtesting” for largest amounts of data on trading results.
>>> Trading Schedule with customizable trading daily time range, automatic closing/alert trades before Power Hour or right before market closes or leave it open until next day.
>>> 3 Trading Systems.
>>> Multiple Signal SOURCEs for opening trades, either SOURCE can be used or both at the same time!
>>> Static/Dynamic Stop-Loss setups (HIGHLIGHT: Stop-Loss will be moved to Entry after TP1 is taken, which minimizes risk).
>>> Single or Multiple profit targets (up to 3).
>>> Take-Profit customizable offset feature (set your Take-Profit targets slightly before everyone is expecting it!).
>>> Candle bar signal analysis (matching candle color, skip opposite structured and/or doji candle uncertain signals).
>>> Additional analysis of VWAP/EMA/ATR/EWO (Elliot Wave Oscillator)/Divergence MACD+RSI/Volume signal confirmation (clean up your chart with indicator showing only the best potential signals!).
>>> Advanced Alerts setup, which can be potentially setup with a trading bot over TradingView Webhook (NOTE: This will require advanced programming knowledge).
===========================================================================
Labels, plots, colors explanations:
---------------------------------------------------------------------------
>>>>> Signal SOURCE(s): Green/Red arrows, which will be shown unconditionally, outside of trade engine and can be hidden if desired.
>>>>> LONG open: green "house" looking arrow below candle bar.
>>>>> SHORT open: red "house" looking arrow above candle bar.
>>>>> LONG/SHORT take-profit target: green/red circles (multi-profit > TP2/3/4/5 smaller circles).
>>>>> LONG/SHORT take-profit hits: green/red diamonds.
>>>>> LONG/SHORT stop-loss target: green/red + crosses.
>>>>> LONG/SHORT stop-loss hits: green/red X-crosses.
>>>>> LONG/SHORT EOD close (profitable trade): green/red squares.
>>>>> LONG/SHORT EOD close (loss trade): green/red PLUS(+)-crosses.
===========================================================================
Date Range and Trading Schedule Settings
---------------------------------------------------------------------------
>>>>> Date Range: Select your start and/or end dates (uncheck “End” for indicator to show results up to the very moment and to use for LIVE trading) for backtesting results, if not using backtesting – uncheck “Start”/“End” to turn it off.
>>>>> Use TradingView “Strategy Tester” to see backtesting results
NOTE: If Strategy Tester does not show any results with Date Ranged fully unchecked, there may be an issue where a script opens a trade, but there is not enough TradingView power to set the Take-Profit and Stop-Loss and somehow an open trade gets stuck and never closes, so there are “no trades present”. In such case you will need to manually check “Start”/“End” dates or use “Depp Backtesting” feature!
>>>>> Trading Schedule: This is where you can setup Intraday Session or any custom session schedule you wish. Turn it ON. Select trading hours. Select EOD (End of Day) setting (NOTE: If it will be OFF, the indicator will assume you are holding your position open until next day!).
>>> Trading Systems: 1) "Open Until Closed by TP or SL": the signal will only open a trade if no trades are currently open/trunning, a trade can only be closed by Take Profit, Stop Loss or End of Day close (if turned on) | 2) "Open Until Closed by TP or SL + OCA": Same as 1), but if there is an opposite signal to the trade which is currently open > it will immediately be closed with new trade open or End of Day close (if turned on) | 3) "OCA (no TP or SL)": There are is Take Profit or Stop Loss, only an opposite signal will close current trade and open an opposite one or End of Day close (if turned on)
>>>>> MULTIPROFIT | TP (Take-Profit) System: Once the trade is open, all Take-Profit target(s) are immediately calculated and set for the trade > once the target(s) is hit > trade will be partially closed (if candle bar closes beyond several Take-Profit targets > trade will be reduced accordingly to the amount of how many Take-Profit targets were hit)
>>>>> MULTIPROFIT | SL (Stop-Loss) System: 1) Static – Once the trade is open, Stop-Loss is calculated and set for the remaining of the trade ||| 2) Dynamic – At trade open, Stop-Loss is calculated and set the same way, however once 1st Take-Profit is taken > Stop-Loss is moved to Entry, reducing the risk.
>>>>> # of TPs (number of take profit targets): Just like it is named, this is where you select the number of Take-Profit targets for your trading system (NOTE: If "OCA (no TP or SL)" Trading System is selected, this setting won’t do anything, since there are no TP or SLs for that system).
>>>>> TP(s) offset: This is a special feature for all Take-Profit targets, where you can turn on a customizable offset, so that if the price is almost hitting the Take-Profit target, but never actually touches it > you will capture it. This is good to use with HHLL (Highest High Lowest Low), which is pretty much a Support/Resistance as often the price will nearly touch these strong areas and turn around…
===========================================================================
Take-Profit and Stop-Loss visual example:
---------------------------------------------------------------------------
1) A simply nice intraday trading day for SPY (S&P500 ETF TRUST) with a single Take-Profit target on each trade.
See how Take-Profit distances increase with price momentum and how Stop-Loss is following the trade reducing the risk!
2) Same intraday trading day for SPY (S&P500 ETF TRUST) with 3 Take-Profit targets with static Stop-Loss.
3) Same intraday trading day for SPY (S&P500 ETF TRUST) with 3 Take-Profit targets with dynamic Stop-Loss.
You can see how Stop-Loss was moved once TP1 is taken!
===========================================================================
Trade Analysis and Cleanup Settings
---------------------------------------------------------------------------
>>>>> Candle Analysis | Candle Color signal confirmation: If closed candle bar color does not match the signal direction > no trade will be open.
>>>>> Candle Analysis | Skip opposite candle signals: If closed candle bar color will match the signal direction, but candle structure will be opposite (for example: bearish green hammer, long high stick on top of a small green square) > no trade will be open.
>>>>> Candle Analysis | Skip doji candle signals: If closed candle bar will be the uncertain doji > no trade will be open.
>>>>> Divergence/Oscillator Analysis | EWO (Elliot Wave Oscillator) signal confirmation: LONG will only be open if at signal, EWO is green or will be at bullish slope (you can select which setting you desire), SHORT if EWO is red or will be at bearish slope.
>>>>> Divergence/Oscillator Analysis | VWAP signal confirmation: LONG will only be open if at signal, the price will be above VWAP, SHORT if below.
>>>>> Divergence/Oscillator Analysis | Moving Average signal confirmation: LONG will only be open if at signal, the price will be above selected Moving Average, SHORT if below.
>>>>> Divergence/Oscillator Analysis | ATR signal confirmation: LONG will only be open if at signal, the price will be above ATR, SHORT if below.
>>>>> Divergence/Oscillator Analysis | RSI + MACD signal confirmation: LONG will only be open if at signal, RSI + MACD will be bullish, SHORT if RSI + MACD will be bearish.
>>>>> Volume signal confirmation: LONG/SHORT will only be open if closing candle volume is 150% above average Volume based on the Volume Length.
===========================================================================
Alert Settings (you don’t have to touch this section unless you will be using TradingView alerts through a Webhook to use with trading bot)
---------------------------------------------------------------------------
Here is how a LONG OPEN alert looks like (each label is customizable + I can add up more items/labels if needed):
COIN: BTCUSD
TIMEFRAME: 15M
LONG: OPEN
ENTRY: 20000
TP1: 20500
TP2: 21000
TP3: 21500
SL: 19000
Leverage: 0
===========================================================================
Adding Alerts in TradngView
---------------------------------------------------------------------------
-Right-click anywhere on the TradingView chart
-Click on Add alert
-Condition: Select this indicator by it’s name
-Alert name: Whatever you want
-Hit “Create”
-Note: If you change ANY Settings within the indicator – you must DELETE the current alert and create a new one per steps above, otherwise it will continue triggering alerts per old Settings!
===========================================================================
If you have any questions or issues with the indicator, please message me directly via TradingView.
---------------------------------------------------------------------------
Good Luck! (NOTE: Trading is very risky, past performance is not necessarily indicative of future results, so please trade responsibly!)

ATR GOD Strategy by TradeSmart (PineConnector-compatible)This is a highly-customizable trading strategy made by TradeSmart, focusing mainly on ATR-based indicators and filters. The strategy is mainly intended for trading forex , and has been optimized using the Deep Backtest feature on the 2018.01.01 - 2023.06.01 interval on the EUR/USD (FXCM) 15M chart, with a Slippage value of 3, and a Commission set to 0.00004 USD per contract. The strategy is also made compatible with PineConnector , to provide an easy option to automate the strategy using a connection to MetaTrader. See tooltips for details on how to set up the bot, and check out our website for a detailed guide with images on how to automate the strategy.
The strategy was implemented using the following logic:
Entry strategy:
A total of 4 Supertrend values can be used to determine the entry logic. There is option to set up all 4 Supertrend parameters individually, as well as their potential to be used as an entry signal/or a trend filter. Long/Short entry signals will be determined based on the selected potential Supertrend entry signals, and filtered based on them being in an uptrend/downtrend (also available for setup). Please use the provided tooltips for each setup to see every detail.
Exit strategy:
4 different types of Stop Losses are available: ATR-based/Candle Low/High Based/Percentage Based/Pip Based. Additionally, Force exiting can also be applied, where there is option to set up 4 custom sessions, and exits will happen after the session has closed.
Parameters of every indicator used in the strategy can be tuned in the strategy settings as follows:
Plot settings:
Plot Signals: true by default, Show all Long and Short signals on the signal candle
Plot SL/TP lines: false by default, Checking this option will result in the TP and SL lines to be plotted on the chart.
Supertrend 1-4:
All the parameters of the Supertrends can be set up here, as well as their individual role in the entry logic.
Exit Strategy:
ATR Based Stop Loss: true by default
ATR Length (of the SL): 100 by default
ATR Smoothing (of the SL): RMA/SMMA by default
Candle Low/High Based Stop Loss: false by default, recent lowest or highest point (depending on long/short position) will be used to calculate stop loss value. Set 'Base Risk Multiplier' to 1 if you would like to use the calculated value as is. Setting it to a different value will count as an additional multiplier.
Candle Lookback (of the SL): 50 by default
Percentage Based Stop Loss: false by default, Set the stop loss to current price - % of current price (long) or price + % of current price (short).
Percentage (of the SL): 0.3 by default
Pip Based Stop Loss: Set the stop loss to current price - x pips (long) or price + x pips (short). Set 'Base Risk Multiplier' to 1 if you would like to use the calculated value as is. Setting it to a different value will count as an additional multiplier.
Pip (of the SL): 10 by default
Base Risk Multiplier: 4.5 by default, the stop loss will be placed at this risk level (meaning in case of ATR SL that the ATR value will be multiplied by this factor and the SL will be placed that value away from the entry level)
Risk to Reward Ratio: 1.5 by default, the take profit level will be placed such as this Risk/Reward ratio is met
Force Exiting:
4 total Force exit on custom session close options: none applied by default. If enabled, trades will close automatically after the set session is closed (on next candle's open).
Base Setups:
Allow Long Entries: true by default
Allow Short Entries: true by default
Order Size: 10 by default
Order Type: Capital Percentage by default, allows adjustment on how the position size is calculated: Cash: only the set cash amount will be used for each trade Contract(s): the adjusted number of contracts will be used for each trade Capital Percentage: a % of the current available capital will be used for each trade
ATR Limiter:
Use ATR Limiter: true by default, Only enter into any position (long/short) if ATR value is higher than the Low Boundary and lower than the High Boundary.
ATR Limiter Length: 50 by default
ATR Limiter Smoothing: RMA/SMMA by default
High Boundary: 1000 by default
Low Boundary: 0.0003 by default
MA based calculation: ATR value under MA by default, If not Unspecified, an MA is calculated with the ATR value as source. Only enter into position (long/short) if ATR value is higher/lower than the MA.
MA Type: RMA/SMMA by default
MA Length: 400 by default
Waddah Attar Filter:
Explosion/Deadzone relation: Not specified by default, Explosion over Deadzone: trades will only happen if the explosion line is over the deadzone line; Explosion under Deadzone: trades will only happen if the explosion line is under the deadzone line; Not specified: the opening of trades will not be based on the relation between the explosion and deadzone lines.
Limit trades based on trends: Not specified by default, Strong Trends: only enter long if the WA bar is colored green (there is an uptrend and the current bar is higher then the previous); only enter short if the WA bar is colored red (there is a downtrend and the current bar is higher then the previous); Soft Trends: only enter long if the WA bar is colored lime (there is an uptrend and the current bar is lower then the previous); only enter short if the WA bar is colored orange (there is a downtrend and the current bar is lower then the previous); All Trends: only enter long if the WA bar is colored green or lime (there is an uptrend); only enter short if the WA bar is colored red or orange (there is a downtrend); Not specified: the color of the WA bar (trend) is not relevant when considering entries.
WA bar value: Not specified by default, Over Explosion and Deadzone: only enter trades when the WA bar value is over the Explosion and Deadzone lines; Not specified: the relation between the explosion/deadzone lines to the value of the WA bar will not be used to filter opening trades.
Sensitivity: 150 by default
Fast MA Type: SMA by default
Fast MA Length: 10 by default
Slow MA Type: SMA
Slow MA Length: 20 by default
Channel MA Type: EMA by default
BB Channel Length: 20 by default
BB Stdev Multiplier: 2 by default
Trend Filter:
Use long trend filter 1: false by default, Only enter long if price is above Long MA.
Show long trend filter 1: false by default, Plot the selected MA on the chart.
TF1 - MA Type: EMA by default
TF1 - MA Length: 120 by default
TF1 - MA Source: close by default
Use short trend filter 1: false by default, Only enter long if price is above Long MA.
Show short trend filter 1: false by default, Plot the selected MA on the chart.
TF2 - MA Type: EMA by default
TF2 - MA Length: 120 by default
TF2 - MA Source: close by default
Volume Filter:
Only enter trades where volume is higher then the volume-based MA: true by default, a set type of MA will be calculated with the volume as source, and set length
MA Type: RMA/SMMA by default
MA Length: 200 by default
Date Range Limiter:
Limit Between Dates: false by default
Start Date: Jan 01 2023 00:00:00 by default
End Date: Jun 24 2023 00:00:00 by default
Session Limiter:
Show session plots: false by default, show market sessions on chart: Sidney (red), Tokyo (orange), London (yellow), New York (green)
Use session limiter: false by default, if enabled, trades will only happen in the ticked sessions below.
Sidney session: false by default, session between: 15:00 - 00:00 (EST)
Tokyo session: false by default, session between: 19:00 - 04:00 (EST)
London session: false by default, session between: 03:00 - 11:00 (EST)
New York session: false by default, session between: 08:00 - 17:00 (EST)
Trading Time:
Limit Trading Time: true by default, tick this together with the options below to enable limiting based on day and time
Valid Trading Days Global: 123567 by default, if the Limit Trading Time is on, trades will only happen on days that are present in this field. If any of the not global Valid Trading Days is used, this field will be neglected. Values represent days: Sunday (1), Monday (2), ..., Friday (6), Saturday(7) To trade on all days use: 123457
(1) Valid Trading Days: false, 123456 by default, values represent days: Sunday (1), Monday (2), ..., Friday (6), Saturday(7) The script will trade on days that are present in this field. Please make sure that this field and also (1) Valid Trading Hours Between is checked
(1) Valid Trading Hours Between: false, 1800-2000 by default, hours between which the trades can happen. The time is always in the exchange's timezone
All other options are also disabled by default
PineConnector Automation:
Use PineConnector Automation: false by default, In order for the connection to MetaTrader to work, you will need do perform prerequisite steps, you can follow our full guide at our website, or refer to the official PineConnector Documentation. To set up PineConnector Automation on the TradingView side, you will need to do the following:
1. Fill out the License ID field with your PineConnector License ID;
2. Fill out the Risk (trading volume) with the desired volume to be traded in each trade (the meaning of this value depends on the EA settings in Metatrader. Follow the detailed guide for additional information);
3. After filling out the fields, you need to enable the 'Use PineConnector Automation' option (check the box in the strategy settings);
4. Check if the chart has updated and you can see the appropriate order comments on your chart;
5. Create an alert with the strategy selected as Condition, and the Message as {{strategy.order.comment}} (should be there by default);
6. Enable the Webhook URL in the Notifications section, set it as the official PineConnector webhook address and enjoy your connection with MetaTrader.
License ID: 60123456789 by default
Risk (trading volume): 1 by default
NOTE! Fine-tuning/re-optimization is highly recommended when using other asset/timeframe combinations.

Swing Algo V1.4◆ Introduction
The latest version of the Swing Algo features a complementary system consisting of two internal swing trading logics: an enhanced Swing Algo V1.3 and a secondary control engine to stabilize the overall strategy behaviour in times of increased market chop. Both algorithms feature different averaging lines as well as oscillators, leading to a higher strategy diversification for swing trading as well as a reduced maximum drawdown in comparison to each stand-alone strategy.
While the Swing Algo V1.x series so far featured a single trend-following swing algorithm for each release, where one just switches between Long and Short trades based on one general logic, here two strategies, which act independently of each other, are applied. Due to this, we introduce a third position a trader can be in: the Hedge. The overall logic is as follows:
When both sub-logics are Long, the overall strategy is Long.
When both sub-logics are Short, the overall strategy is Short.
When one sub-logic is Long and the other is Short, the overall strategy is in a Hedge position. It doesn't matter which component is Short and which is Long.
As PineScript doesn't currently offer a real steady hedging-function for two competing swing trading sub-logics (in the sense of a continuously applied Hedge state after hedging conditions are met at least once for an entry), a workaround via position closes was created for this release. For each new internal sub-signal, the overall strategy changes its state (Long/Short/Hedge) visibly on the chart, and the trader can adjust their position accordingly.
For detailed differences to previous Swing Algo V1.x releases, see further below.
◆ Purpose of this Script
This indicator will give Long, Short and Hedge signals on the chart that can be used for e.g. swing trading. Each of the aforementioned sub-logics uses a combination of several (custom) functions and rules to find good entry points for trend trading. After many iterations and tests I came up with this particular setup, which is highly optimized for the ETH/USD trading pair on the daily (D) timeframe.
Attention was also paid to stability, as all parameters are set onto plateaus, so that smaller changes in the characteristic price action should not affect the efficiancy too much, done as an attempt to reduce overfitting as much as possible. Additionally this dual algorithm system is specifically designed to have a safety net: should for the unlikely scenario one swing trading algorithm not trigger at a certain mid-term reversal point, the probability is high that the other will trigger, resulting in an overall hedged position (so that no money is lost in the meantime) until the first algorithm can rejoin at the next mid-term trend change.
For other assets and/or timeframes it is in principle possible to change algorithmic parameters within the indicator settings to tune the swing algorithms, though it is strongly recommended to use the standard asset and timeframe mentioned above.
◆ Viability
For the here presented backtest data, we omitted the biggest portion of the cryptocurrency bullrun in 2017 (starting only at 1st July 2017) so that the results become more realistic for long-term swing traders (investing at least 2-4 years into trading) if such large runs do not happen again. As cryptocurrencies like Ethereum are still to this date capable of doing comparatively smaller runs of about 2-3x in a few weeks/months during accumulation phases (as witnessed e.g. in 2020 and more recently in 2023) and bigger runs during bullmarkets (as witnessed in 2021), the quality of the shown results is still realistic for long-term trend trading efforts over several years, Note that very conservative trading parameters as mentioned below in "Forwardtesting and Backtesting" are used here.
Generally do not expect results in a matter of days or weeks, and of course as with any trading strategy past performances are not indicative of future results.
◆ Forwardtesting and Backtesting
The individual components have been back- and partially forwardtested: The first sub-logic is an advancement of Swing Algo V1.3, with which we have extensive experience running back to October 2020 for its release, while the secondary control strategy, which was privately published for DeanTrader members as a stand-alone script on TradingView in June 2022 and was running in the background since then, is showing good & expected behaviour so far.
While this does not mean that fowardtesting was performed specifically for the combined Swing Algo V1.4 system we have now (which cannot be done realistically considering the timeframes used, i.e. months and especially years), we can at least look at some considerable experience with the individual components. Then again, as I have implemented an exact hedging-function so that both sub-algorithms run independently from each other, it is not likely to see any unexpected behaviour resulting purely from the combination into one script.
For strategy backtesting you can choose the backtest time interval to test the performance of this algorithm for different time windows and different trading pairs. Here various backtesting parameters (e.g. trading fees) can be customized. Default settings for the shown backtest are a starting balance of $1000, a slippage of 20 ticks (= $0.20) and a trading fee of 0.05 % (which is the worst taker fee on the Kraken Pro futures exchange) to have realistic settings. However as we do not conduct many trades with this strategy, fees should not impact our performance too much. As long-term swing traders, we at DeanTrader generally devote one initial portion of our portfolio to swing trading and from then on always use 100% of this portion for the next trade to get the compounding starting. This is in difference to other trading styles which use various, often very small, percentage values for their short- or mid-term trades. Please note that for the here presented backtest only 10% of compounded equity is used for each successive trade to show an estimation for a lower risk & lower reward approach . Keep this in mind when evaluating the backtest data. You can set appropriate values for each backtest parameter in the "Properties" setting menu of the strategy, including the order size percentage of equity value for your trades. Also note that due to the small number of trades the statistical significance is low. It is not possible to gather an abundance of long-term trend signals in the order of hundreds or thousands trades, as much more time would have to pass for this in the case of rather new assets like Ethereum.
Additionally to the TradingView Strategy Tester you can also plot your equity directly on the chart to get a sense for the performance. For this you can also scale the equity graph to e.g. match the starting point of your equity with some price point on the chart to get a direct comparison to 'Buy & Hold' strategies over time.
This indicator (and all other content I provide) is no financial advice. If you use this indicator you agree to my Terms and Conditions which can be found on my website linked on my TradingView profile or in my signature.
◆ Visual Representation on the Chart
Shown below is a screenshot of how the chart looks like when the strategy is applied. Here we can see two different averaging lines, where each line belongs to one of the two sub-logics respectively. Note that this is not a MA-crossover strategy, and the crossing of the lines is not accounted for in the code at all and therefore has no effect on the strategy's signal output. Also note that the price scale is set on logarithmic.
The space between the lines is filled with a faint background color as a rough visual indicator. Magenta-colored fills indicate zones where only Short or Hedge signals can appear, while green-colored fills indicate zones where only Long or Hedge signals can appear. Gray-colored fills mark zones where only Hedge signals can appear, which also means that Hedge signals can appear in any zone. So treat those background fills more as a visual aid to roughly know what can happen next, but pay most attention to the actual signals (with arrows) that appear on the chart.
◆ Differences to Other Versions
Consists now of two competing sub-algorithms instead of just one algorithm. The new system outputs Long, Short and Hedge signals instead of just Long and Short signals.
The first sub-logic is the spiritual successor of the original Swing Algo V1.3 release, with a modified oscillator part.
The second sub-logic serves as a control algorithm (while still having equal rights in terms of strategy impact), newly introduced to the Swing Algo series, but already forwardtested for roughly a year at time of release.
Lowers risk significantly by diversifying swing trading strategies, so that for the rare scenario of a missed trend on one sub-algorithm, losses are prevented as the overall strategy is hedged during that time.
Lowers risk further as the maximum drawdown of the combined strategy is reduced by roughly 1/3 in comparison to each stand-alone strategy while almost retaining the same net profit over a 6-year backtest compared to the first, leading sub-logic.
No guesswork anymore when to use which short leverage (1x corresponding to a Hedge, or 2x corresponding to a Short with an asset-value-change-to-gain-proportionality of -1) as it is clearly defined within the trading system via the displayed signals. In earlier Swing Algo versions, the short leverage for any particular Short signal had to be chosen by hand dependent on market sentiment, which required further market analysis, or was fixed at 2x, leading to less flexibility.
◆ Access
For access please contact me via DM on TradingView or via other channels (linked on my TradingView profile and in my signature).
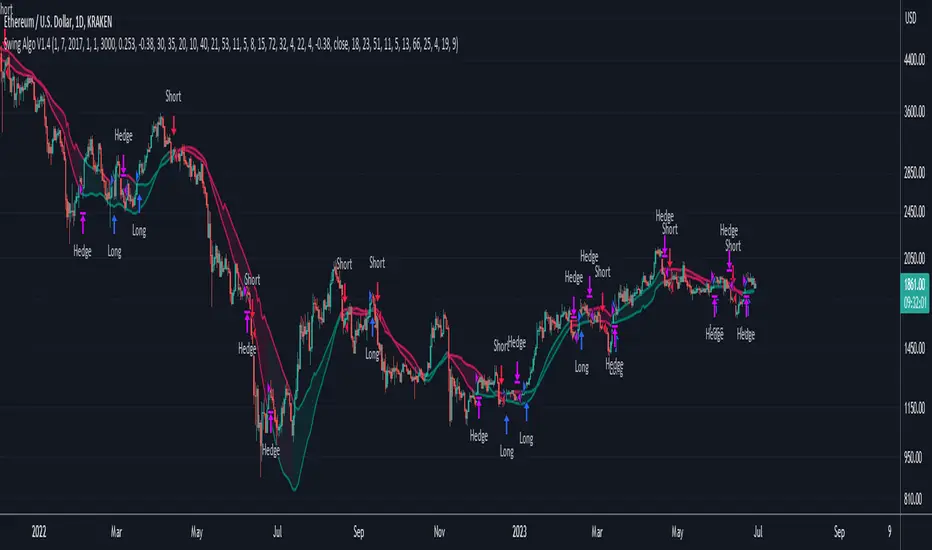
METRIC-TREND-TRADERThis script is a Fully Automated trading script meant to be used with "Oanda" broker and the plug-ins for algorithmic trading automation.( FOREX ONLY)
This script is meant to capture "TREND FOLLOWING " for intraday charts (1hour) preferably and will hold for days / weeks .trading on forex markets.
(The combination of indicators includes a short high and low price channel and a longer term high and low price channel)
This script is original in description as being automated to try and capture dynamic trending markets with both long and short fractal price channels. although trend trading is not an original concept. trend trading with this dynamic indicator allows the user visualize both short term and longer term price action at the same time, helping to make better trading decisions. the channels are designed to buy breakouts in the direction of the longer term trend while trailing stop a built-in stop loss that allows normal market movement while attempting to lock in flexible profits.
The concept of this indicator is be able to quickly visualize trends by high lighting the large green areas beneath price "when trending long" which is the difference between the (user defined) short term lows and the (user defined) Long period price lows.
For "down trending" markets a large red area above price will be displayed and this is the difference between the (user defined) short term highs and the (user defined) long term highs.
This strategy uses a lower than reward profile to jump in direction of market moves for continuation,
(1 risk to 4 reward)
in the likelihood the instrument will continue (example) 200 pips before it reverts 50 pips in the counter direction.
This strategy should only be used in markets that you believe are "TRENDING" at the time of trading otherwise you risk trend trading a range market.
This script uses a (user defined period) of short term high and low price ( green/red color) and (user defined period) Long Term high and low price (green/red) chosen in the indicator settings menu.
The default parameters are 10 with a (minimum of 1 and maximum of 10000) for the short term channel and 50 with a (minimum of 1 and maximum of 10000) for the long term price channel , the default parameters = roughly 2 days "long term" and 10 hours "short term" of price action on the (1 hour) chart.
Strategy entries and exits , for Long trades the trade will be entered if the short term high crosses above the Long Term high and the Short term low is not equal to the Long term low . the trade will exit if profit or stop loss are hit or if the Short term low crosses under the long term low.
For Short trades the trade will enter short if , the short term low crosses under the long term low and the short term high is not equal to the long term high. the trade will exit if profit or stop loss are hit or the short term high crosses over the long term high
"The default parameters should be kept unless you fully understand the complete strategy"
There are two very important inputs to be selected at the user setting menu "Long Only " and "Short Only" if you are looking to place long trades only select "Long Only" or for short trades select " Short Only" it is not recommended to keep both selected as it will trade both sides!
When the trade is entered a red , a blue and green horizontal dotted line will appear on the chart.
the blue line is the strategy entry price , the red line is the stop loss price , and the green line is the take profit price . the colors will invert if the trade is long or short.
(Setting alerts should be done in the indicator settings menu, and the parameters you chose will determine the stop loss/target and the amount of "units = (position size)" you wish to trade for the (forex only) markets. using "alert() function calls only" is the only alert that should be used with this strategy.
(note : when "alert() function calls only" is set two messages will be sent, one closing any open position in the opposite direction and one placing the new order regardless if you are currently in a trade or not)
Trade targets , stoploss and trade position size are a user defined variables entered in the indicator settings menu. (target pips minimum 0 and a maximum of 1000)(stop pips minimum of 0 and maximum of 1000)
Back test date range is included in the script for back testing different data periods.
the back ground will be colored a transparent navy blue if the period you are looking trading is with in the date range( note: to place live trades the end date will need to be in the future)
this is also adjustable in the settings menu
The avoid spread filter is a user defined time in which the spread is typically higher than average, applying this filter avoids trades in the specified time. When this filter is applied there will be a transparent red back ground color in the specified time.
Back test default setting are equivocal to OANDA:USDJPY
at the time of this publication placing trades with the "Oanda" broker are as follows , USD units = 2000 equal 2000 USD position size . "Oanda" current leverage is 20 to 1 for this particular pair and commission is paid in spread (1.4) pips = 0.19 USD per trade , Margin required for the trade is 100.0 USD , Position sizing = 10% of a 1000 USD account.
OANDA:USDJPY

BE-TrendLines & Price SentimentsOverview
The trendline is one of the most potent and flexible tools in trading. A rising trendline indicates an upward trend, a falling trendline indicates a downward trend, and a flat trendline indicates a range-bound bond market.
Breakouts, price bounces, and reversal / Retest tactics are all types of trades that may be made using a trendline. Additionally, stop-loss and profit-trailing orders can be based on trendlines as support and resistance levels, appropriately.
Technical Calculations for Trendlines & Price Sentiments:
Pivot points for a specified time frame and the Prevailing High/Low for the most recent bars are used to derive trendlines. While Pivot Points alert us to price movements, High/Low tells us where Bulls and Bears find a middle ground. This provides a remarkable set of conditions from which to extrapolate the efficacy of the Trendlines.
The term "price sensitivity" refers to how much a change in the price of a product causes consumers to alter their purchase habits. It's the relationship between price shifts and shifts in consumer demand. So, for example, if a 30% jump in the cost of a product leads to a 10% drop in purchases, we can conclude that the item has a price sensitivity of 0.33%.
Basis the above theoretical statement, If the underlying asset's price drops, the indicator shall compute data on the amount of volume being pumped (Inflow vs Outflow) into the market (if available), or the percentage by which the price has changed. This will be compared to the recent drop rate to see if the behavior has changed at the similar value zone and non similar value zone. similar calculation shall be done if the price of the underlying rises.
Traders may benefit from hearing about Trendlines in their "Story Telling" form, which we now present. To help you comprehend it better, candles are divided into three Sentiment groups based on their color. Colors: Green (with its shades), Silver, and Red (including its shades). Green signifies a Bullish Trend, Silver a neutral trend, and Red a Brearish Trend.
Bullish Trend
Bearish Trend
Neutral Trend
Sentiment Price Cycle in Trending Market: Green (Directional Bullish), Dark Green (Bullish Trend Loosing its Strength), Silver (Neutral Trend), Red (Directional Bearish), Dark Red (Bearish Trend Loosing its Strength)
Sentiment Price Cycle in RangeBound Market: Green (Over Brought), Silver (Neutral) & Red (Over Sold)
How to Initiate Trade when price is within TL:
Fake Break Out Trade:
BreakDown Trade:
BreakOut Trade:
Couple of Other Features in the Indicator:
Single Alerts = These are the alerts where in, as and when the Event happens Alerts shall the trigerred. like On BreakOut, BreakDown, TouchOf Up TrendLine, TouchOf DownTrendLine, Retest Of Up TrendLine, Retest of DownTrendLine.
Conditional Alerts = These are those type of Alerts where in you can combine 2 or 3 conditions to trigger an Alert. Like
Sample 1 - After Down TL is tested for 3 times, If BreakOut happens and the setiment turns Bullish within 5 Candles.
Sample 2 - After Up TL is tested for 2 times, If Price Bounces backUp from TL and the setiment turns Bullish within 5 Candles.
Similarly you can customize the combination of events for getting the alert.
DISCLAIMER: No sharing, copying, reselling, modifying, or any other forms of use are authorized for our documents, script / strategy, and the information published with them. This informational planning script / strategy is strictly for individual use and educational purposes only. This is not financial or investment advice. Investments are always made at your own risk and are based on your personal judgement. I am not responsible for any losses you may incur. Please invest wisely.
Happy to receive suggestions and feedback in order to improve the performance of the indicator better.